- Справка Scilab
- Signal Processing
- Filters
- How to design an elliptic filter
- analpf
- buttmag
- casc
- cheb1mag
- cheb2mag
- ell1mag
- eqfir
- eqiir
- faurre
- ffilt
- filt_sinc
- filter
- find_freq
- frmag
- fsfirlin
- group
- hilbert
- iir
- iirgroup
- iirlp
- kalm
- lev
- levin
- lindquist
- remez
- remezb
- srfaur
- srkf
- sskf
- syredi
- system
- trans
- wfir
- wfir_gui
- wiener
- wigner
- window
- yulewalk
- zpbutt
- zpch1
- zpch2
- zpell
Please note that the recommended version of Scilab is 2026.1.0. This page might be outdated.
See the recommended documentation of this function
wiener
Wiener estimate
Syntax
[xs,ps,xf,pf]=wiener(y,x0,p0,f,g,h,q,r)
Arguments
- f, g, h
system matrices in the interval
[t0,tf]- f
=
[f0,f1,...,ff], andfkis a nxn matrix- g
=
[g0,g1,...,gf], andgkis a nxn matrix- h
=
[h0,h1,...,hf], andhkis a mxn matrix
- q, r
covariance matrices of dynamics and observation noise
- q
=
[q0,q1,...,qf], andqkis a nxn matrix- r
=
[r0,r1,...,rf], andgkis a mxm matrix
- x0, p0
initial state estimate and error variance
- y
observations in the interval
[t0,tf].y=[y0,y1,...,yf], andykis a column m-vector- xs
Smoothed state estimate
xs= [xs0,xs1,...,xsf], andxskis a column n-vector- ps
Error covariance of smoothed estimate
ps=[p0,p1,...,pf], andpkis a nxn matrix- xf
Filtered state estimate
xf= [xf0,xf1,...,xff], andxfkis a column n-vector- pf
Error covariance of filtered estimate
pf=[p0,p1,...,pf], andpkis a nxn matrix
Description
function which gives the Wiener estimate using the forward-backward Kalman filter formulation
Sample
Examples
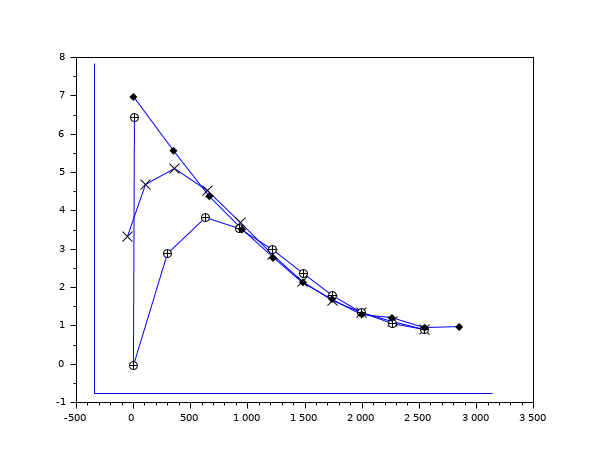
// initialize state statistics (mean and er. variance)
m0=[10 10]';
p0=[100 0;0 100];
// create system
f2=[1.1 50.1;0 0.8];
g=[1 0;0 1];
h=[1 0;0 1];
[hi,hj]=size(h);
// noise statistics
q=[.01 0;0 0.01];
r=20*eye(2,2);
// initialize system process
rand("seed",66);
rand("normal");
p0c=chol(p0);
x0=m0+p0c'*rand(ones(m0));
y=h*x0+chol(r)'*rand(ones(1:hi))';
yt=y;
// initialize plotted variables
x=x0;
// loop
ft=[f2];
gt=[g];
ht=[h];
qt=[q];
rt=[r];
n=10;
for k=1:n
    // generate the state and observation
    // at time k (i.e. xk and yk)
    [x1,y]=system(x0,f2,g,h,q,r);
    x=[x x1];
    yt=[yt y];
    x0=x1;
    ft=[ft f2];
    gt=[gt g];
    ht=[ht h];
    qt=[qt q];
    rt=[rt r];
end
// get the wiener filter estimate
[xs,ps,xf,pf]=wiener(yt,m0,p0,ft,gt,ht,qt,rt);
// plot result
a=min([x(1,:)-2*sqrt(ps(1,1:2:2*(n+1))),xf(1,:),xs(1,:)]);
b=max([x(1,:)+2*sqrt(ps(1,1:2:2*(n+1))),xf(1,:),xs(1,:)]);
c=min([x(2,:)-2*sqrt(ps(2,2:2:2*(n+1))),xf(2,:),xs(2,:)]);
d=max([x(2,:)+2*sqrt(ps(2,2:2:2*(n+1))),xf(2,:),xs(2,:)]);
xmargin=max([abs(a),abs(b)]);
ymargin=max([abs(c),abs(d)]);
a=-0.1*xmargin+a;
b=.1*xmargin+b;
c=-0.1*ymargin+c;
d=.1*ymargin+d;
// plot frame, real state (x), and estimates (xf, and xs)
scf();
plot([a a b],[d c c]);
plot2d(x(1,:)',x(2,:)',[2],"000")
plot2d(xf(1,:)',xf(2,:)',[2],"000")
plot2d(xs(1,:)',xs(2,:)',[2],"000")
// mark data points (* for real data, o for estimates)
plot2d(xs(1,:)',xs(2,:)',[-2],"000")
plot2d(xf(1,:)',xf(2,:)',[-3],"000")
plot2d(x(1,:)',x(2,:)',[-4],"000")
| Report an issue | ||
| << wfir_gui | Filters | wigner >> |