Scilab 6.0.2
Please note that the recommended version of Scilab is 2026.1.0. This page might be outdated.
See the recommended documentation of this function
xarc
楕円の一部を描画する
呼び出し手順
xarc(x,y,w,h,a1,a2)
引数
- x,y,w,h
矩形を定義する実数値.
- a1,a2
扇形を定義する実数値.
説明
xarc は,矩形(x,y,w,h)
(左上の点,幅,高さ)の中,および
角度 alpha1 および角度 alpha1+alpha2
で定義される扇形の中に含まれる楕円の一部を描画します.
alpha1および alpha2 は
a1/64 度および a2/64度
によりそれぞれ指定されます.
この関数はカレントのグラフィック色およびユーザ座標を使用します.
例
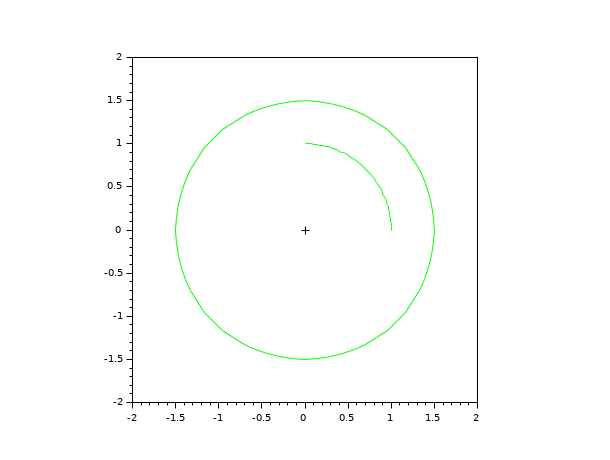
// 等軸スケーリング

plot2d(0,0,-1,"031"," ",[-2,-2,2,2])

xarc(-1,1,2,2,0,90*64)

xarc(-1.5,1.5,3,3,0,360*64)

gca().children(1:2).foreground = color("green");
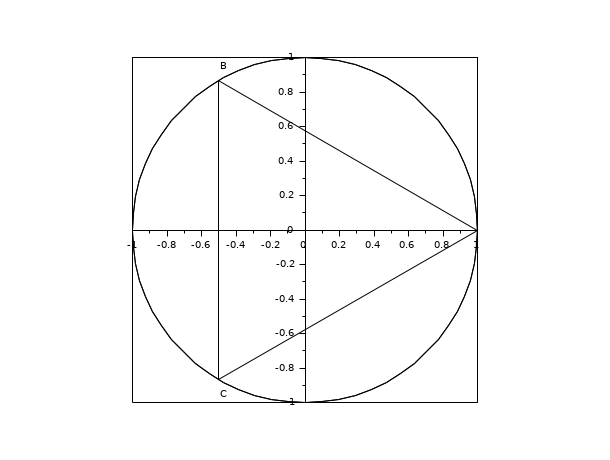
rect=[-1,-1,1,1]

plot2d(0,0,0,rect=rect,frameflag=3,axesflag=5)

xrpoly([0,0],3,1)

xarc(-1,1,2,2,0,64*360)

xarc(-1,1,2,2,0,64*360)

xstring(1,0.1,'A')//label A

xstring(-0.5,0.9,'B')//label B

xstring(-0.5,-1,'C')//label C
| Report an issue | ||
| << segs_properties | geometric_shapes | xarcs >> |