- Scilabヘルプ
- Graphics
- 2d_plot
- champ
- champ1
- champ_properties
- comet
- contour2d
- contour2di
- contour2dm
- contourf
- errbar
- fchamp
- fec
- fec_properties
- fgrayplot
- fplot2d
- grayplot
- grayplot_properties
- graypolarplot
- histplot
- LineSpec
- Matplot
- Matplot1
- Matplot_properties
- paramfplot2d
- plot
- plot2d
- plot2d2
- plot2d3
- plot2d4
- polarplot
- scatter
- Sfgrayplot
- Sgrayplot
Please note that the recommended version of Scilab is 2026.1.0. This page might be outdated.
See the recommended documentation of this function
scatter
2D scatter plot
Syntax
polyline = scatter(x, y, msizes, mcolors, "fill", marker, <marker_property, value>)
polyline = scatter(axes_handle,...)
Arguments
- x, y
Columns or rows vectors of n real numbers specifying the abscissae and the ordinates of the centers of markers.
- msizes
Specifying the sizes of the markers. To plot each marker with equal sizes, specify
msizesas a scalar. To plot each marker with a different size, specifymsizesas a vector with length equal to the length ofxandx. The units formsizesis points squared with a default value of 36 points squared. The size equals the area of the circle surrounding the marker.- mcolors
Specifying the colors of the markers. To plot each marker with the same color, specify
mcolorsas a string representing a known color, see color_list. A color can also be specified by a vector of 3 RGB values between 0 and 1. To plot each marker with a different color, specifymcolorsas a vector with length equal to the length ofx. The values ofmcolorsare linearly mapped to the colors in the current colormap. Colors can also by specified by a matrix of RGB values or a vector of strings representing known colors. A matrix of RGB values has 3 columns and the number of rows equals the length ofx. The default color is "blue".- "fill"
This string indicates that the markers are filled with some colors. By default, the filling colors are the same as the patterns ones. Both sets of colors can be defined independently by using the properties
"markerFaceColor"or"markerBackgroundColor".- marker
Select the type of the marker. The same marker shape is used for all specified points. The figure below shows the 15 different marker types.
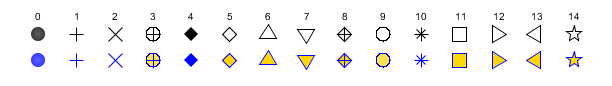
Marker types are specified by strings, see the table below.
String Marker type "."Point "+"Plus sign "x"Cross "circle plus"Circle with plus "filled diamond"Filled diamond "d"or"diamond"Diamond "^"Upward-pointing triangle "v"Downward-pointing triangle "diamond plus"Diamond with plus "o"Circle (default) "*"Asterisk "s"or"square"Square ">"Right-pointing triangle "<"Left-pointing triangle "pentagram"or"p"Five-pointed star - <marker_property, value>
A sequence of property value pairs can be used to specify type, color and line width of the markers.
- <"marker", value> or <"markerStyle", value>
Specify the type of the marker, see the table above.
- <"markerEdgeColor", value> or <"markerForeground", value>
Specify the foreground color of the marker. A color can be specified by a string representing a known color, see color_list. A color can also be specified by a vector of 3 RGB values. RGB values correspond to red, green and blue intensity between 0 and 1. This option is superseded by argument
mcolors.- <"markerFaceColor",value> or <"markerBackground",value>
Specify the background color of the marker. A color can be specified by a string representing a known color see color_list. A color can also be specified by a vector of 3 RGB values. RGB values correspond to red, green and blue intensity between 0 and 1. This option is superseded by argument
mcolors.- <"linewidth",value> or <"thickness",value>
Specify the thickness of the edge of the marker. The unit for the value is one point.
- <axes_handle>
This optional argument forces the scatter plot to appear inside the selected axes given by
axes_handlerather than inside the current axes, see gca.- polyline
Handle of the created polyline.
Description
scatter(x,y) creates a scatter plot with markers centered at
the (x, y) set of coordinates.
The default type of the marker is a circle, the default color is "blue" and the default
size is 36.
This means the circle surrounding the marker has an area of 36 points squared.
Different sizes and colors for each marker can be specified with
scatter(x,y,msizes,mcolors).
There are many different ways to specify marker types, marker colors and marker sizes.
For more details see the description of the arguments and the examples.
 | To skip an argument, just replace it with [] like in
scatter3(x,y,z,[],mcolors). |
Examples
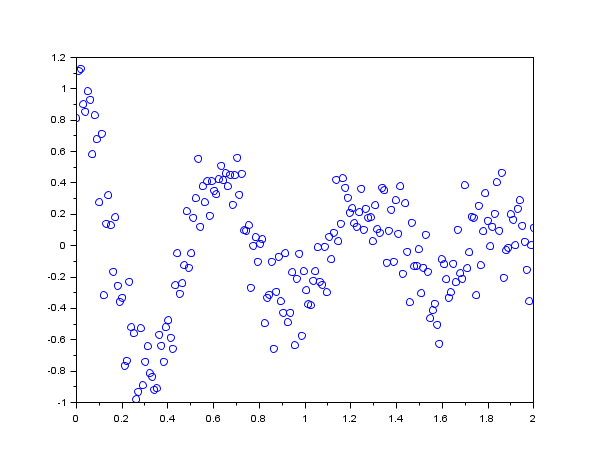
Create 2D scatter plot
// x and y initialisation
x = linspace(0,2,200);
y = exp(-x).*cos(10*x) + 0.2*rand(1,length(x));
// create 2D scatter plot
scatter(x,y);
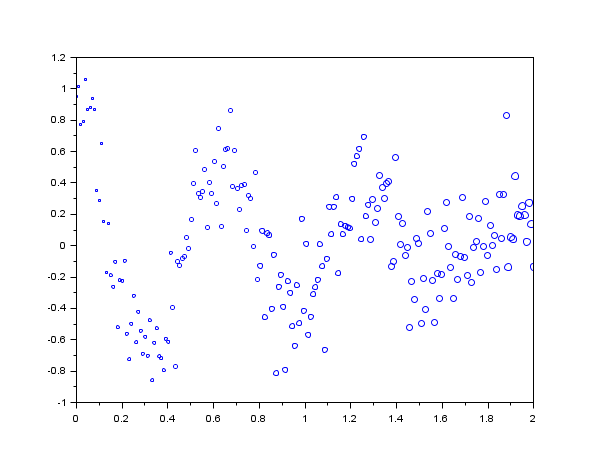
Vary marker size
// x and y initialisation
x = linspace(0,2,200);
y = exp(-x).*cos(10*x) + 0.2*rand(1,length(x));
// specify different sizes
s = linspace(1,30,length(x));
// create 2D scatter plot
scatter(x, y, s);
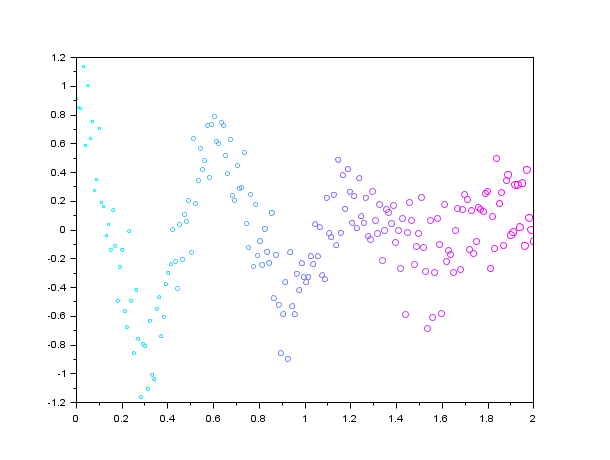
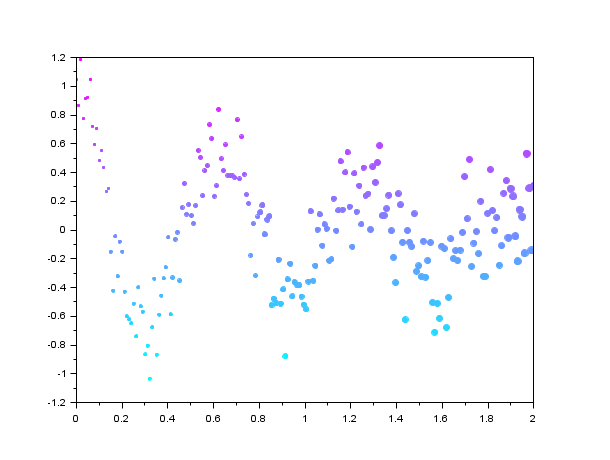
Vary marker size and color
// x and y initialisation
x = linspace(0, 2, 200);
y = exp(-x).*cos(10*x) + 0.2*rand(1,length(x));
// specify different sizes
s = linspace(1, 30, length(x));
// set color map
gcf().color_map = coolcolormap(64);
// colors according to x values
c = x;
// create 2D scatter plot
scatter(x,y,s,c);
Fill the markers
// x and y initialisation
x = linspace(0, 2, 200);
y = exp(-x).*cos(10*x) + 0.2*rand(1,length(x));
// specify different sizes
s = linspace(1, 30, length(x));
// set color map
gcf().color_map = coolcolormap(64);
// colors according to y values
c = y;
// create 2D scatter plot
scatter(x, y, s, c, "fill");
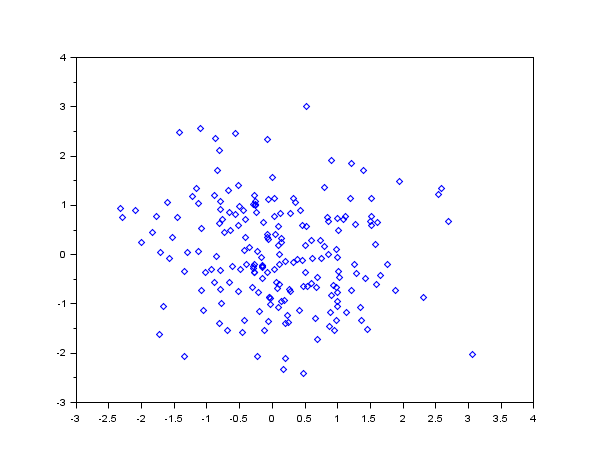
Specify marker symbol
// x and y initialisation
x = rand(1, 200);
y = rand(1, 200);
// create 2D scatter plot
scatter(x, y, "d");
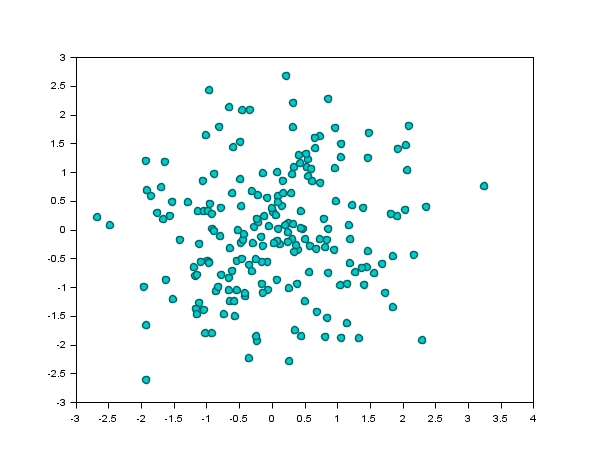
Change marker color and line width
// x and y initialisation
x = rand(1, 200);
y = rand(1, 200);
// create 2D scatter plot
scatter(x, y, "markerEdgeColor",[0 .4 .4],...
              "markerFaceColor",[0 .8 .8],...
              "linewidth",1.5);
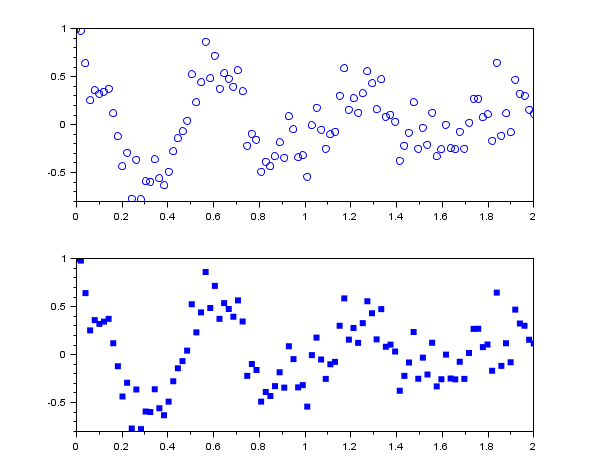
Specify subplot for scatter plot
// x and y initialisation
x = linspace(0, 2, 100);
y = exp(-x).*cos(10*x) + 0.2*rand(1,length(x));
// create 2D scatter subplot
subplot(2, 1, 1)
scatter(gca(), x, y);
// create 2D scatter subplot
subplot(2, 1, 2)
scatter(gca(), x, y, "fill", "s");
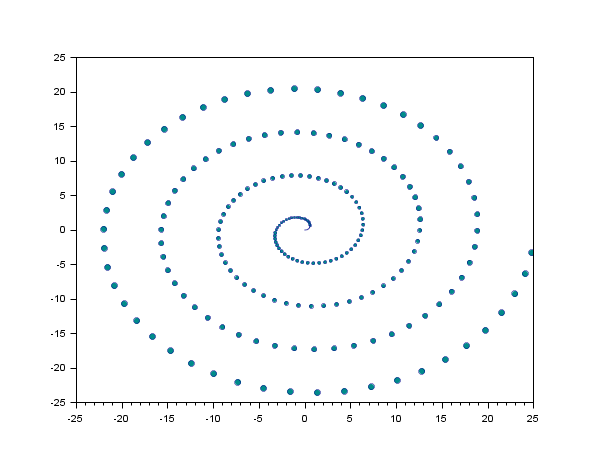
Modify scatter plot after creation
// x and y initialisation
t = linspace(0,1,200);
x = t .* cos(10*%pi*t);
y = t .* sin(10*%pi*t);
// create 2D scatter plot
p = scatter(x, y);
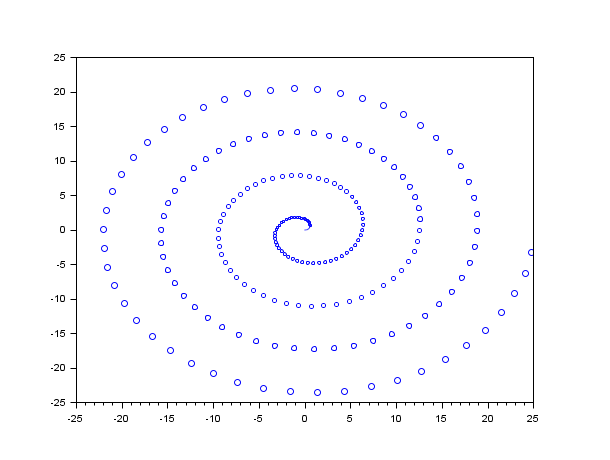
// modify polyline
p.thickness = 0.5;
p.mark_foreground = color("darkblue");
p.mark_background = color("darkcyan");
See also
- scatter3 — 3D scatter plot
- plot — 2Dプロット
- gca — カレントの軸のハンドルを返す.
- gcf — カレントグラフィックウインドウのハンドルを返す.
- color_list — 色の名前のリスト
- polyline_properties — Polylineエンティティプロパティの説明
History
| Version | Description |
| 6.0.0 | Function scatter introduced. |
| Report an issue | ||
| << polarplot | 2d_plot | Sfgrayplot >> |