Scilab Website | Contribute with GitLab | Mailing list archives | ATOMS toolboxes
Scilab Online Help
6.0.0 - Русский

Change language to:
English - Français - 日本語 - Português -

Please note that the recommended version of Scilab is 2025.0.0. This page might be outdated.
See the recommended documentation of this function

Справка Scilab >> CACSD > Linear Analysis > Frequency Domain > freson

freson

peak frequencies

Syntax

fr=freson(h)

Arguments

h

syslin list

fr

vector of peak frequencies in Hz

Description

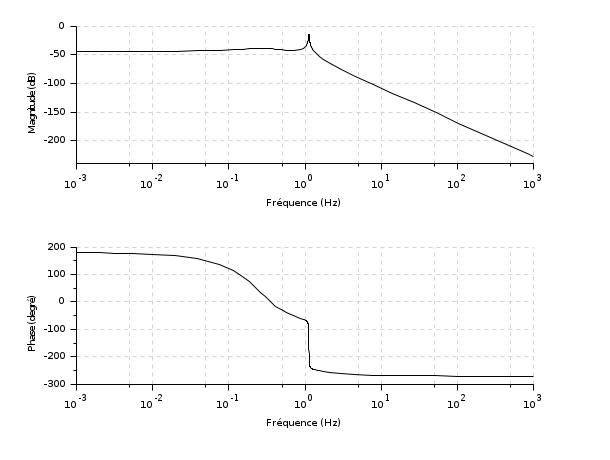
returns the vector of peak frequencies in Hz for the SISO plant h

Examples

h=syslin('c',-1+%s,(3+2*%s+%s^2)*(50+0.1*%s+%s^2))
fr=freson(h)
bode(h)
g=20*log(abs(repfreq(h,fr)))/log(10)
See also

  • frep2tf — transfer function realization from frequency response
  • zgrid — zgrid plot
  • h_norm — H-infinity norm
Report an issue
<< freq Frequency Domain gainplot >>

Copyright (c) 2022-2024 (Dassault Systèmes)
Copyright (c) 2017-2022 (ESI Group)
Copyright (c) 2011-2017 (Scilab Enterprises)
Copyright (c) 1989-2012 (INRIA)
Copyright (c) 1989-2007 (ENPC)
with contributors
Last updated:
Tue Feb 14 15:13:23 CET 2017