Please note that the recommended version of Scilab is 2026.1.0. This page might be outdated.
See the recommended documentation of this function
replot
reformula a área de exibição de um ou mais gráficos
Seqüência de Chamamento
replot()
replot(area)
replot(idAxes)
replot(area, idAxes)
replot(.., tight_limits)
Parâmetros
- area
row vector [xmin ymin xmax ymax] or [xmin ymin zmin xmax ymax zmax]: new bounds of the area to be replotted.
The default area is [%inf %inf %inf %inf] for a 2D axes, or [%inf %inf %inf %inf %inf %inf] for a 3D one.
%nancan be used to keep a bound as is.%infcan be used to set a bound to the position of the most marginal graphical component existing in the axes, for the considered direction.
If N axes are identified in
idAxes,areamay be a matrix with N rows and 4 or 6 columns. The row #i is then related to the axes #i ofidAxes. Ifareais only a vector of 4 or 6 bounds, these ones are used for all axes to be reframed.- idAxes
Vector of graphic handles, expected to be of Axes type or to have direct children of type Axes, such as Figures or some frame uicontrols.
idAxesspecifies direct or children Axes to crop. If no axes is found, nothing is done.By default, the current Axes is considered.
- tight_limits
Single word
"tight"or"on"or"off", or vector of 2 (in 2D) or 3 (in 3D) words"tight"or"on"or"off". If a single word is provided, it is used for every axis. This option forces the.tight_limitsattribute of considered axes to the specified"on"or"off"values. By default, current limits modes are unchanged.
Descrição
replot is used to reframe the (set of) axes specified
with idAxes -- or by default the current axes --
with new boundaries defined by
area = [xmin,ymin, xmax,ymax] or
area = [xmin,ymin,zmin, xmax,ymax,zmax].
It changes the data_bounds attribute of processed axes.
When a specified bound is infinite (%inf and -%inf are equivalent),
replot looks for the most marginal graphical object
and sets the actual related bound to its position, taking also
objects sizes into account. This ensures not clipping any object
that would be beyond the targeted side of the axes.
When the tight_limits option is provided,
its value is assigned to the .tight_limits
attribute of each considered axes, in an axis-wise way.
Exemplos
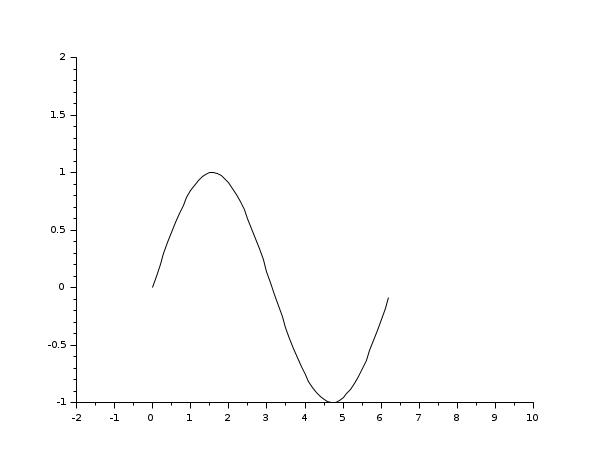
// segundo exemplo
xdel(winsid());
plot() // plot demo
f=gcf();
replot([-1,-1,10,2],f.children(1)) // especificando o valor do manipulador dos eixos
replot([-3,-2,8,4],f.children(2))
// Os fronteiras indicadas pelo valor %nan não são alterados:
x = linspace(0,360,200).';
clf
plot2d(x,[sind(x) tand(x)])
ax = gca();
ax.data_bounds              // Fronteiras iniciais
replot([%nan,-10,%nan,10])  // Ymin e Ymax só são modificados
ax.data_bounds              // novas fronteiras
// 3D Fronteiras Z também pode ser modificadas :
clf
x = linspace(-4,4,100);
X = meshgrid(x);
R = (X-0.5).^2 + (X.'+0.7).^2;
Z = sinc(R);
surf(x-0.5,x+0.7,Z)
f = gcf();
f.color_map = autumncolormap(100);
ax = gca();
ax.data_bounds
sleep(3000)
replot([-5 0 -0.4 0 5 0.5])
ax.data_bounds
// Diversos gráficos podem ser cortadas simultaneamente :
clf
x = linspace(-%pi,%pi,400);
subplot(2,2,1)
plot2d(x,sin(1 ./sqrt(abs(x))))
ax1 = gca();
subplot(2,2,2)
plot2d(x,sinh(sqrt(abs(x))))
subplot(2,1,2)
plot2d(x,cos(1 ./sqrt(abs(x))))
ax2 = gca();
sleep(4000)
f = gcf();
replot([-1 %nan 1.5 %nan], [ax1 ax2])
Ver Também
- zoom_rect — Amplia uma seleção da figura gráfica corrente
- rubberbox — Caixa tipo liga de borracha para seleção de um retângulo
- axes_properties — descrição das propriedades de entidades Axes (de eixos)
Histórico
| Versão | Descrição |
| 5.5.0 |
|
| 6.0 |
|
| Report an issue | ||
| << plotframe | axes_operations | rotate_axes >> |