Please note that the recommended version of Scilab is 2026.1.0. This page might be outdated.
See the recommended documentation of this function
replot
新しい境界を指定してカレントまたは指定した軸で再描画
呼び出し手順
replot()
replot(area)
replot(idAxes)
replot(area, idAxes)
replot(.., tight_limits)
引数
- area
行ベクトル [xmin ymin xmax ymax] または [xmin ymin zmin xmax ymax zmax]: 再プロットされる領域の新しい範囲.
The default area is [%inf %inf %inf %inf] for a 2D axes, or [%inf %inf %inf %inf %inf %inf] for a 3D one.
- 範囲を変えない場合は
%nanを使用してください. %infcan be used to set a bound to the position of the most marginal graphical component existing in the axes, for the considered direction.
If N axes are identified in
idAxes,areamay be a matrix with N rows and 4 or 6 columns. The row #i is then related to the axes #i ofidAxes. Ifareais only a vector of 4 or 6 bounds, these ones are used for all axes to be reframed.- 範囲を変えない場合は
- idAxes
Vector of graphic handles, expected to be of Axes type or to have direct children of type Axes, such as Figures and possibly frame uicontrols.
idAxesspecifies direct or children Axes to crop. If no axes is found, nothing is done.By default, the current Axes is considered.
- tight_limits
Single word
"tight"or"on"or"off", or vector of 2 (in 2D) or 3 (in 3D) words"tight"or"on"or"off". If a single word is provided, it is used for every axis. This option forces the.tight_limitsattribute of considered axes to the specified"on"or"off"values. By default, current limits modes are unchanged.By default, current limits modes are unchanged.
説明
replot is used to reframe the (set of) axes specified
with idAxes -- or by default the current axes --
with new boundaries defined by
area = [xmin,ymin, xmax,ymax] or
area = [xmin,ymin,zmin, xmax,ymax,zmax].
It changes the data_bounds attribute of processed axes.
When a specified bound is infinite (%inf and -%inf are equivalent),
replot looks for the most marginal graphical object
and sets the actual related bound to its position, taking also
objects sizes into account. This ensures not clipping any object
that would be beyond the targeted side of the axes.
When the tight_limits option is provided,
its value is assigned to the .tight_limits
attribute of each considered axes, in an axis-wise way.
例
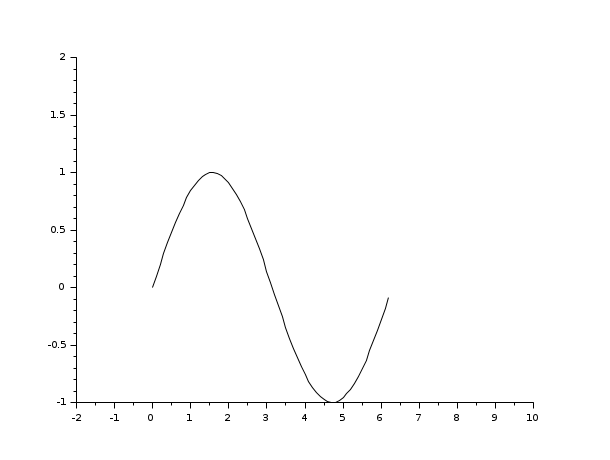
// 二番目の例
xdel(winsid());
plot() // plot demo
f=gcf();
replot([-1,-1,10,2],f.children(1)) // axesハンドルの値を指定
replot([-3,-2,8,4],f.children(2))
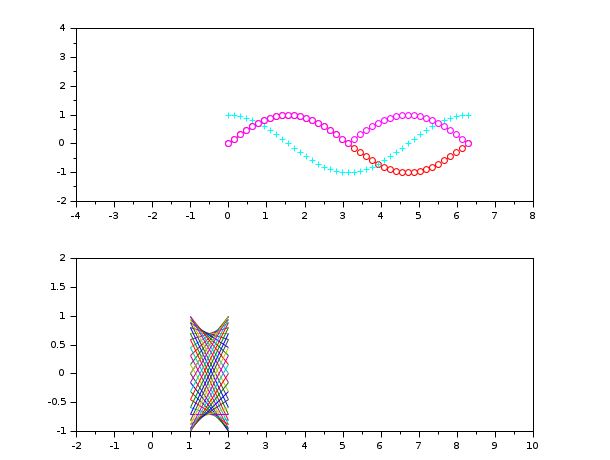
//値は%nanで示さ端子は変更されません。
x = linspace(0,360,200).';
clf
plot2d(x,[sind(x) tand(x)])
ax = gca();
ax.data_bounds              // 初期限界
replot([%nan,-10,%nan,10])  // YminとYmaxのだけ変更され
ax.data_bounds              // 新しい制限
参照
- zoom_rect — カレントのグラフィック図の選択した部分をズーム
- rubberbox — 矩形選択用の輪ゴムボックス
- axes_properties — axesエンティティプロパティの説明
履歴
| バージョン | 記述 |
| 5.5.0 |
|
| 6.0 |
|
| Report an issue | ||
| << plotframe | axes_operations | rotate_axes >> |