Scilab 6.0.0
Please note that the recommended version of Scilab is 2026.1.0. This page might be outdated.
See the recommended documentation of this function
show_margins
ゲイン余裕/位相余裕とそれぞれの交差周波数を表示する
呼出し手順
show_margins(h)
show_margins(h,'bode')
show_margins(h,'nyquist')
パラメータ
- h
SISO 線形システム (参照 :syslin).
説明
連続または離散時間系の SISO 線形システムを指定すると
show_margins はゲイン余裕、位相余裕および
それぞれの交差周波数をボード線図(デフォルト)もしくは
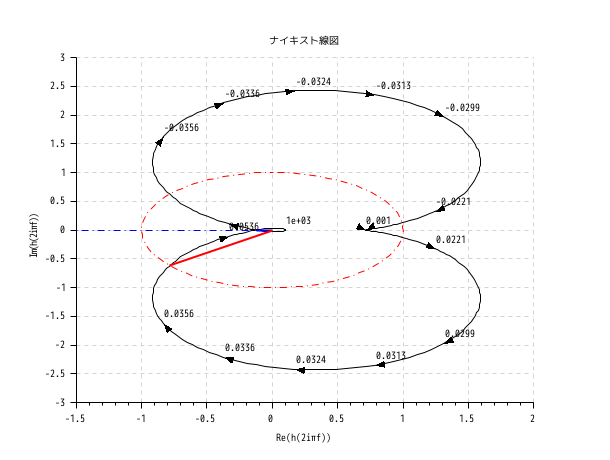
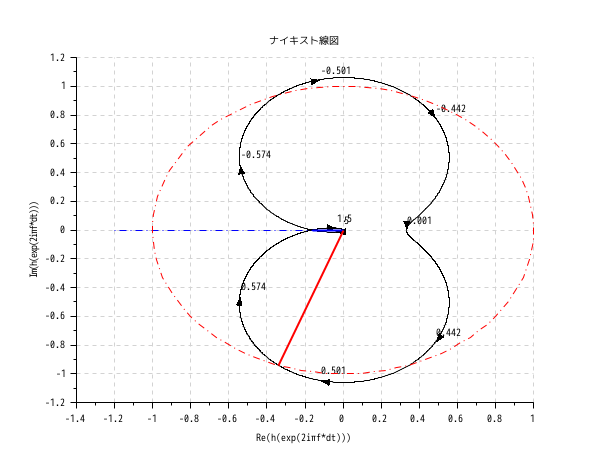
システムの周波数応答をナイキスト線図に表示します.
例
//continuous case
h=syslin('c',0.02909+0.11827*%s+0.12823*%s^2+0.35659*%s^3+0.256*%s^4+0.1*%s^5,..
             0.0409+0.1827*%s+1.28225*%s^2+3.1909*%s^3+2.56*%s^4+%s^5);
show_margins(h)
show_margins(h,'nyquist')
//discrete case
h = syslin(0.1,0.01547+0.01599*%z ,%z^2-1.81*%z+0.9048)
show_margins(h)
show_margins(h,'nyquist')
| Report an issue | ||
| << sgrid | Stability | st_ility >> |