Scilab 6.0.0
- Scilab Help
- Graphics
- 2d_plot
- LineSpec
- Matplot
- Matplot1
- Matplot properties
- Sfgrayplot
- Sgrayplot
- champ
- champ1
- champ properties
- comet
- contour2d
- contour2di
- contour2dm
- contourf
- errbar
- fchamp
- fec
- fec properties
- fgrayplot
- fplot2d
- grayplot
- grayplot properties
- graypolarplot
- histplot
- paramfplot2d
- plot
- plot2d
- plot2d2
- plot2d3
- plot2d4
- polarplot
- scatter
Please note that the recommended version of Scilab is 2026.1.0. This page might be outdated.
See the recommended documentation of this function
plot2d2
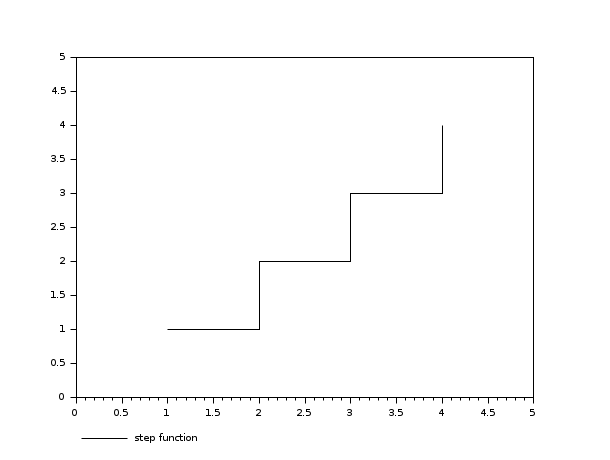
2D plot (step function)
Syntax
plot2d2([x],y)
plot2d2([x],y,<opt_args>)
plot2d2([logflag],x,y,[style,strf,leg,rect,nax])
Arguments
- args
see
plot2dfor a description of parameters.
Description
plot2d2 is the same as plot2d but the
functions given by (x,y) are supposed to be piecewise
constant.
By default, successive plots are superposed. To clear the previous
plot, use clf().
Enter the command plot2d2() to see a demo.
 | Note that all the modes proposed by plot2dxx (xx = 1 to 4) can be enabled
using plot2d and setting the polyline_style
option to the corresponding number. |
Examples
// plots a step function of value i on the segment [i,i+1]
// the last segment is not drawn
plot2d2([1:4],[1:4],1,"111","step function",[0,0,5,5])
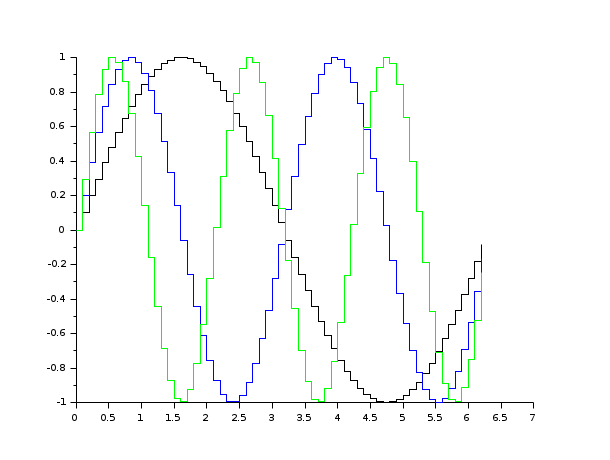
x=[0:0.1:2*%pi]';
clf();
plot2d(x,[sin(x) sin(2*x) sin(3*x)])
e=gce();
e.children(1).polyline_style=2;
e.children(2).polyline_style=2;
e.children(3).polyline_style=2;

See also
| Report an issue | ||
| << plot2d | 2d_plot | plot2d3 >> |