Please note that the recommended version of Scilab is 2026.0.1. This page might be outdated.
See the recommended documentation of this function
replot
新しい境界を指定してカレントまたは指定した軸で再描画
呼び出し手順
replot(area)
replot(area, axesHandles)
引数
- area
行ベクトル [xmin ymin xmax ymax] または [xmin ymin zmin xmax ymax zmax]: 再プロットされる領域の新しい範囲.
 範囲を変えない場合は
%nanを使用してください.- axesHandles
Axes型のグラフィックハンドルのベクトル: 選択する軸. デフォルトで, カレントの図のカレントの軸が指定されます.
説明
replot はカレントのグラフィックウインドウの内容を
area = [xmin,ymin, xmax,ymax]または
area = [xmin,ymin,zmin, xmax,ymax,zmax]で定義した新しい境界内に
再描画する際に使用されます.
この変換はaxesHandles引数でAxesグラフィックハンドルにより
指定された特定の軸に適用できます.
axesHandlesが指令されない場合,
新しい境界はカレントの図のカレントの軸に適用されます.
変換はこれらの軸のdata_boundsの値を変更します.
 | これらの範囲を厳密に選択するために
axesのプロパティ tight_limitsを"on" に設定する必要があります
(axes_propertiesを参照ください). |
例

// 二番目の例

xdel(winsid());

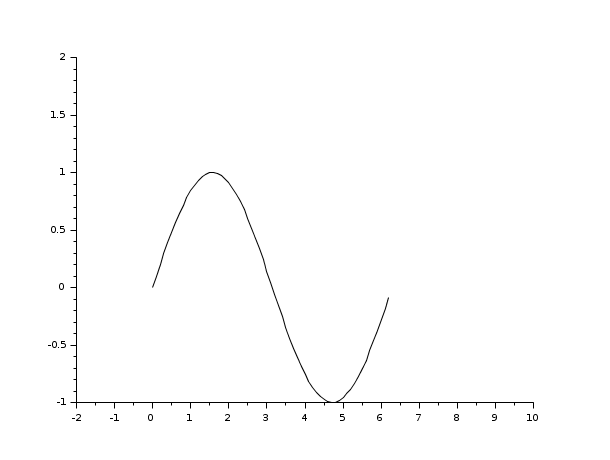
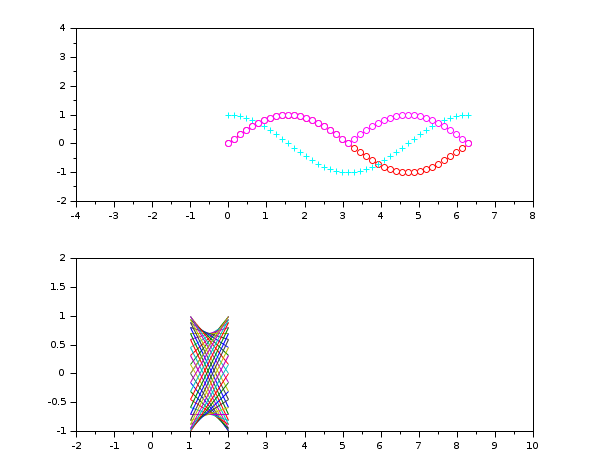
plot() // plot demo

f=gcf();

replot([-1,-1,10,2],f.children(1)) // axesハンドルの値を指定

replot([-3,-2,8,4],f.children(2))

//値は%nanで示さ端子は変更されません。

x = linspace(0,360,200).';

clf

plot2d(x,[sind(x) tand(x)])

ax = gca();

ax.data_bounds                // 初期限界

replot([%nan,-10,%nan,10])    // YminとYmaxのだけ変更され

ax.data_bounds                // 新しい制限

// 3D端末Zも変更できます。

clf

x = linspace(-4,4,100);

X = meshgrid(x);

R = (X-0.5).^2 + (X.'+0.7).^2;

Z = sinc(R);

surf(x-0.5,x+0.7,Z)

f = gcf();

f.color_map = autumncolormap(100);

ax = gca();

ax.data_bounds

sleep(3000)

replot([-5 0 -0.4 0 5 0.5])

ax.data_bounds

// いくつかのグラフィカルなマーカーを同時にトリミングすることができます。

clf

x = linspace(-%pi,%pi,400);

subplot(2,2,1)

plot2d(x,sin(1 ./sqrt(abs(x))))

ax1 = gca();

subplot(2,2,2)

plot2d(x,sinh(sqrt(abs(x))))

subplot(2,1,2)

plot2d(x,cos(1 ./sqrt(abs(x))))

ax2 = gca();

sleep(4000)

f = gcf();

replot([-1 %nan 1.5 %nan], [ax1 ax2])
参照
- zoom_rect — カレントのグラフィック図の選択した部分をズーム
- rubberbox — 矩形選択用の輪ゴムボックス
- axes_properties — axesエンティティプロパティの説明
履歴
| バージョン | 記述 |
| 5.5.0 |
|
| Report an issue | ||
| << plotframe | axes_operations | rotate_axes >> |