Scilab 5.5.1
Please note that the recommended version of Scilab is 2026.0.1. This page might be outdated.
See the recommended documentation of this function
geom3d
3次元プロットの後に3次元から2次元へ投影する
呼び出し手順
[x,y]=geom3d(x1,y1,z1)
引数
- x1,y1,z1
同じ大きさの実数ベクトル (3次元の点).
- x,y
x1,y1およびz1と同じ 大きさの実数ベクトル.
説明
geom3dは,
plot3d, plot3d1 または param3d
のような3次元プロット関数の後に使用され,
3次元空間(x1(i),y1(i),z1(i))
における点と投影された二次元平面上の対応する点(x(i),y(i))
の間のマッピングを行ないます.
この後,(x,y)に行う全ての2次元グラフィックプリミティブを
この3次元プロット上への重ね合わせるために使用できます.
例
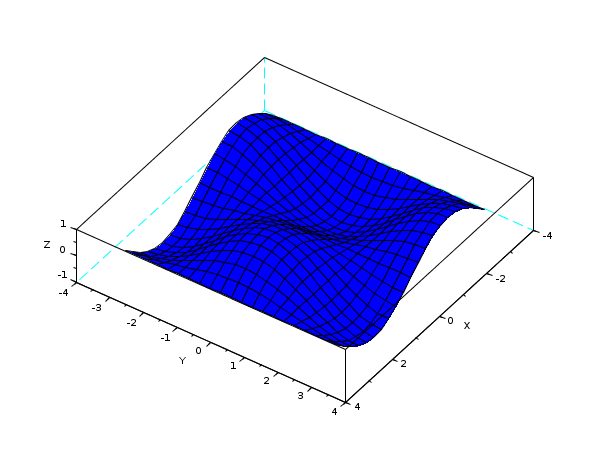
deff("[z]=surface(x,y)","z=sin(x)*cos(y)")

t=%pi*(-10:10)/10;

// 曲面の3次元プロット

fplot3d(t,t,surface,35,45,"X@Y@Z")

// ここで, (t,t,sin(t).*cos(t))は曲面上の曲線で,

// geom3d および xpolyにより描画される

[x,y]=geom3d(%pi/2,0,surface(%pi/2,0))

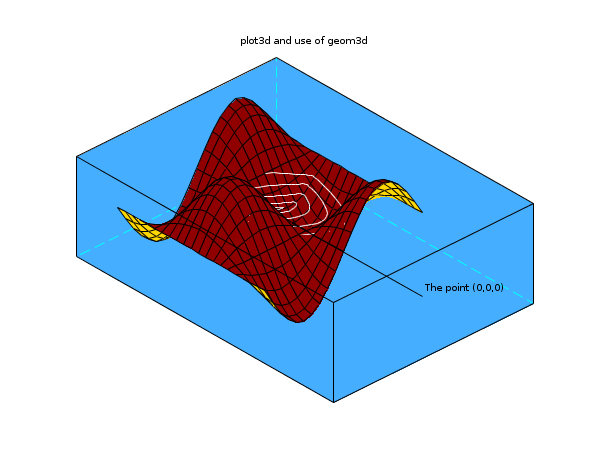
my_plot_desc          = "plot3d and use of geom3d";

  r = (%pi):-0.01:0;

x = r.*cos(10*r);

y = r.*sin(10*r);

deff("[z]=Surf(x,y)","z=sin(x)*cos(y)");

t=%pi*(-10:10)/10;

// 曲面をプロット

fplot3d(t,t,Surf,35,45,"X@Y@Z",[19,2,3]);

// 3次元グラフィック上に2次元グラフィックを追加

z=(sin(x).*cos(y));

[x1,y1] = geom3d(x,y,z);

xpoly(x1,y1,"lines");

// いくつかのプロット用パラメータを調整

BackgroundColorId           = color(70,174,255);

current_axe                 = gca();

plot_3d                     = current_axe.children(2);

plot_3d.hiddencolor         = 32;

polyline                    = current_axe.children(1)';;

polyline.foreground         = 8;

current_axe.rotation_angles = [70,47];

current_axe.background      = BackgroundColorId;

// 2番目の2次元グラフィック

[x1,y1] = geom3d([0,0],[0,0],[5,0]);

xsegs(x1,y1);

xstring(x1(1),y1(1),"The point (0,0,0)");

xtitle(my_plot_desc," "," "," ");

| Report an issue | ||
| << genfac3d | 3d_plot | hist3d >> |