Please note that the recommended version of Scilab is 2026.1.0. This page might be outdated.
However, this page did not exist in the previous stable version.
hist3d
3次元ヒストグラム
呼び出し手順
hist3d(mtx,[theta,alpha,leg,flag,ebox])
hist3d(mtx,<opt_args>)
hist3d(list(mtx,x,y),[theta,alpha,leg,flag,ebox])
hist3d(list(mtx,x,y),<opt_args>)
引数
- mtx
大きさ (m,n) の行列で, ヒストグラム
mtx(i,j)=F(x(i),y(j))を定義します. ただし,xおよびyは0:mおよび0:nの範囲とします.- list(mtx,x,y)
mtxは大きさ(m,n)の行列で,ヒストグラム
mtx(i,j)=F(x(i),y(j))を定義します.xおよびyは, 大きさ (1,m+1) および (1,n+1)のベクトルです.- <opt_args>
一連の命令
key1=value1, key2=value2,...を定義します.ただし,key1,key2,...には以下のどれかを指定できます: theta, alpha,leg,flag,ebox. plot3dを参照ください.- theta,alpha,leg,flag,ebox
plot3dを参照くださ.
説明
hist3d は2次元ヒストグラムを3次元プロットとして
表します.この値は,間隔[x(i) x(i+1)[ X [y(i)
y(i+1)[
に関連します.
コマンド hist3d() を入力するとデモを参照できます.
例
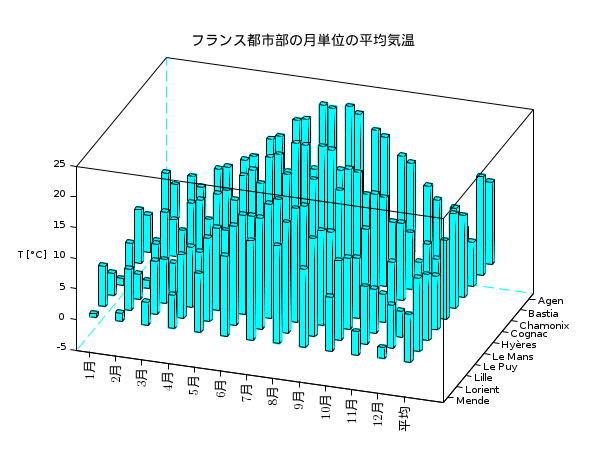
hist3d();
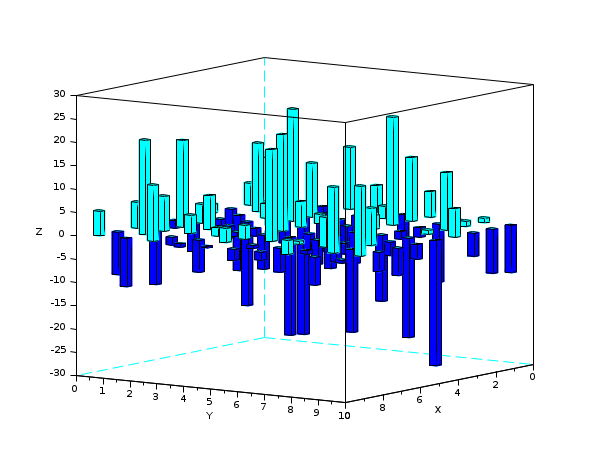
hist3d(10*rand(10,10));
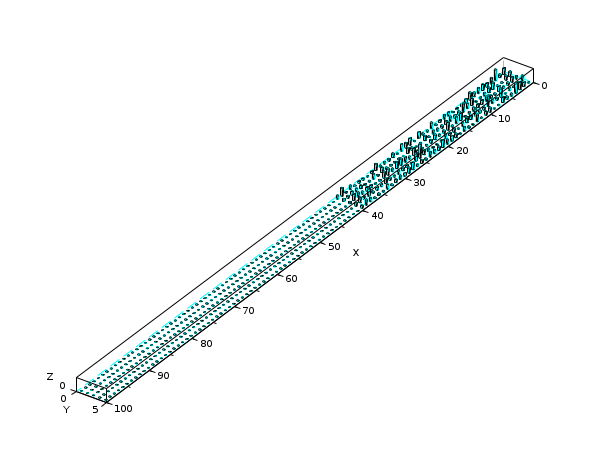
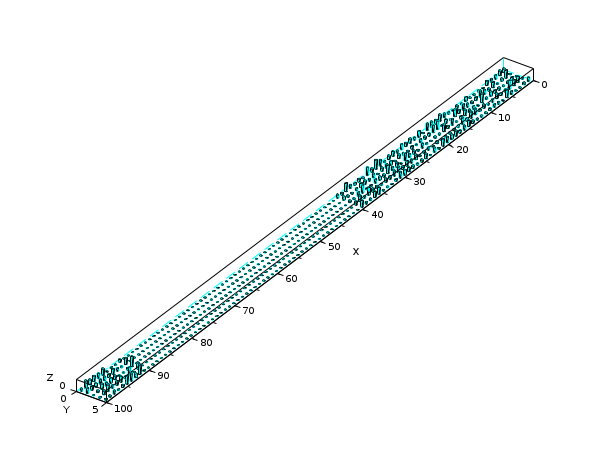
Z = zeros(100,5);
A = abs(rand(40,5));
Z(1:40,:) = A;
Index = find(Z==0);
Z(Index) = %nan;
scf();
hist3d(Z);
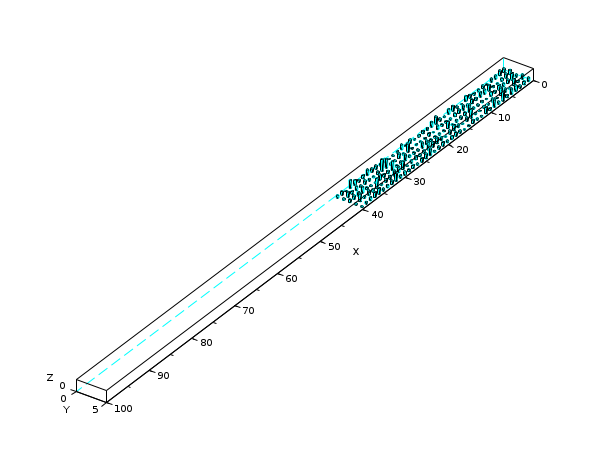
Z = zeros(100,5);
A = abs(rand(40,5));
Z(1:40,:) = A;
A = abs(rand(10,5));
Z(91:100,:) = A;
scf();
hist3d(Z);
| Report an issue | ||
| << geom3d | 3d_plot | mesh >> |