Scilab Website | Contribute with GitLab | Mailing list archives | ATOMS toolboxes
Scilab Online Help
5.4.0 - 日本語

Change language to:
English - Français - Português - Русский

Please note that the recommended version of Scilab is 2024.0.0. This page might be outdated.
See the recommended documentation of this function

Scilab help >> Graphics > axes_operations > subplot

subplot

グラフィックウインドウをサブウインドウの行列に分割する

呼び出し手順

subplot(m,n,p)
subplot(mnp)

引数

m,n,p

正の整数

mnp

10進表記の整数 mnp

説明

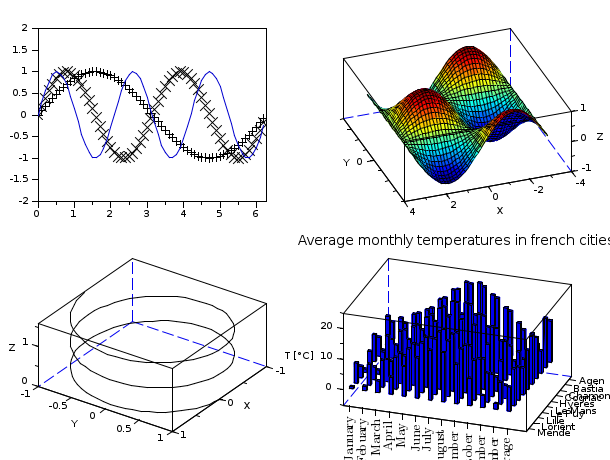
subplot(m,n,p) または subplot(mnp) はグラフィックウインドウを m行n列のサブウインドウの行列に分割し, p番目のサブウインドウを描画先として選択します. サブウインドウの番号は,行優先でカウント,つまり, 行列の要素(i,j)に対応するサブウインドウは(i-1)*n + j番となります.

subplot(221)
plot2d()
subplot(222)
plot3d()
subplot(2,2,3)
param3d()
subplot(2,2,4)
hist3d()

参照

  • plot2d — 2Dプロット
  • plot3d — 曲面の3次元プロット
  • xstring — 文字列を描画
  • xtitle — グラフィックスウインドにタイトルを追加する
Report an issue
<< sda axes_operations unzoom >>

Copyright (c) 2022-2023 (Dassault Systèmes)
Copyright (c) 2017-2022 (ESI Group)
Copyright (c) 2011-2017 (Scilab Enterprises)
Copyright (c) 1989-2012 (INRIA)
Copyright (c) 1989-2007 (ENPC)
with contributors
Last updated:
Mon Oct 01 17:40:33 CEST 2012