Scilab 5.3.0
- Scilab Online Help
- Graphics Library
- Datatips
- datatipCreate
- datatipGetEntities
- datatipGetStruct
- datatipInitStruct
- datatipsRemoveAll
- datatipManagerMode
- datatipMove
- datatipRedraw
- datatipRemove
- datatipRemoveAll
- datatipSetDisplay
- datatipSetInterp
- datatipSetOrientation
- datatipSetStruct
- datatipToggle
- datatips
- orthProj
Please note that the recommended version of Scilab is 2026.1.0. This page might be outdated.
See the recommended documentation of this function
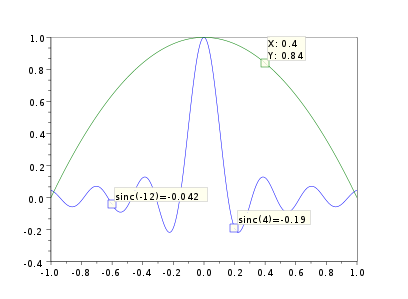
datatipSetDisplay
指定した点に最も近いdatatipを探索する.
呼び出し手順
datatipSetDisplay(tip_handle,orient)
パラメータ
- tip_handle
datatipのハンドル.
- orient
文字列で,次の値を指定可能り:
"automatic""upper left""upper right","lower left","lower right".
説明
曲線の点に関するテキストボックスの相対位置を設定します.
向きに"automatic"を指定すると,
プログラムはテキストボックスをプロットの範囲内に収めるように
選択を行ないます.
例
x=linspace(-1,1,1000);
clf()
plot(x,sinc(20*x),x,1-x^2);
e=gce();e=e.children;
d21=datatipCreate(e(2),600);
d22=datatipCreate(e(2),200);
d1=datatipCreate(e(1),700);

function str=mydisplay(curve, pt, index)
   str=msprintf('sinc(%-0.2g)=%-0.2g', 20*pt(1),pt(2))
endfunction
datatipSetDisplay(e(2),mydisplay)
作者
- Serge Steer, INRIA
| << datatipRemoveAll | Datatips | datatipSetInterp >> |