xpoly
ポリラインまたはポリゴンを描画する
呼び出し手順
xpoly(xv,yv [,dtype [,close]])
引数
- xv,yv
同じ大きさの行列 (ポリラインの点).
- dtype
文字列 (描画形式). デフォルト値は "lines".
- close
整数. close=1の場合, ポリラインは閉じられます; デフォルト値は 0です.
説明
xpoly は座標xv およびyvの
ベクトルにより記述されるポリラインを1つ描画します.
xv および
yv が行列の場合, これらは列を結合したベクトルとみなされます.
dtype はカレントの線種を用いる場合には
"lines",ポリラインを描画する際に
カレントのマーカを使用する場合には"marks"となります.
例
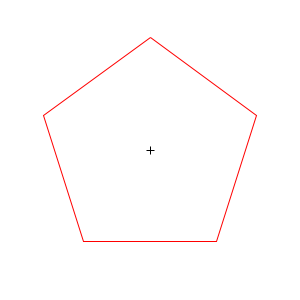
x = sin(2*%pi*(0:4)/5);
y = cos(2*%pi*(0:4)/5);

plot2d(0,0,-1,"010"," ",[-1,-1,1,1])  // draw an empty bounded axes
xpoly(x, y)
set(gce(), "foreground", color("red"), "closed", "on");
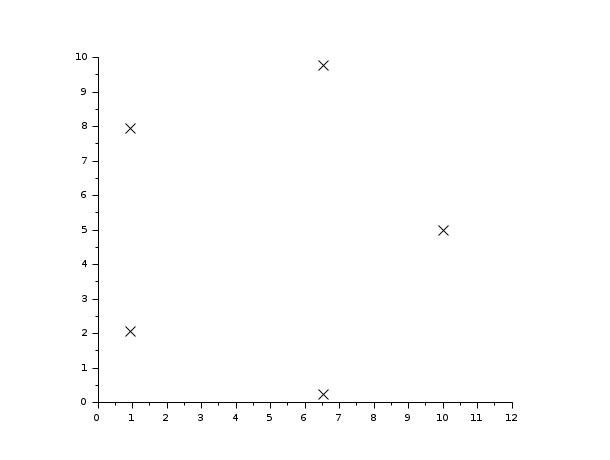
// 線ではなく記号を使用

plot2d(0,0,1,rect=[0,0,12,10], frameflag=3)

t=[0:4]*2*%pi/5;

x=5+5*cos(t);

y=5+5*sin(t);

xpoly(x,y,"marks")

e=gce();

set(e,"mark_style",2);
参照
- xfpoly — ポリゴンを塗りつぶす
- xfpolys — 一連のポリゴンを塗りつぶす
- xpolys — 一連のポリラインまたはポリゴンを描画
- polyline_properties — Polylineエンティティプロパティの説明
| Report an issue | ||
| << xfpolys | polygon | xpolys >> |