fplot2d
2D plot of a curve defined by a function (obsolete)
Syntax
fplot2d(xr,f,[style,strf,leg,rect,nax])
fplot2d(xr,f,<opt_args>)
Arguments
- xr
vector.
- f
external of type
y=f(x)i.e. a scilab function or a dynamically linked routine referred to as a string.- style,strf,leg,rect,nax
see
plot2d- <opt_args>
see
plot2d
Description
 | fplot2d() is obsolete and will be removed from Scilab 6.2.x.
Please use plot(xr,f,..) instead. |
fplot2d plots a curve defined by the external function
f. The curve is approximated by a piecewise linear
interpolation using the points (xr(i),f(xr(i)). The values of
f(x) are obtained by feval(xr,f).
Enter the command fplot2d() to see a demo.
Examples
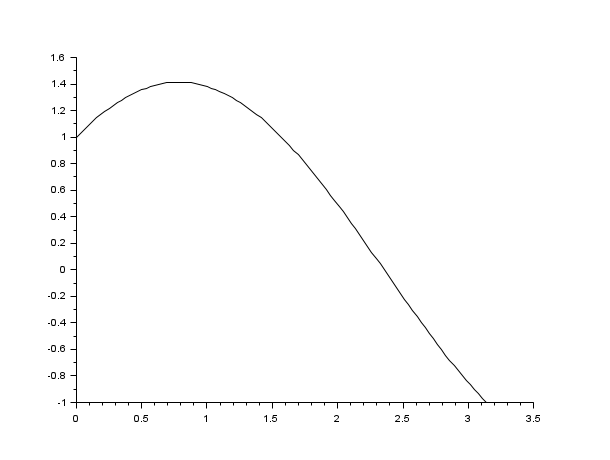
deff("y = f(x)", "y = sin(x)+cos(x)")
x = [0:0.1:10]*%pi/10;
fplot2d(x,f)
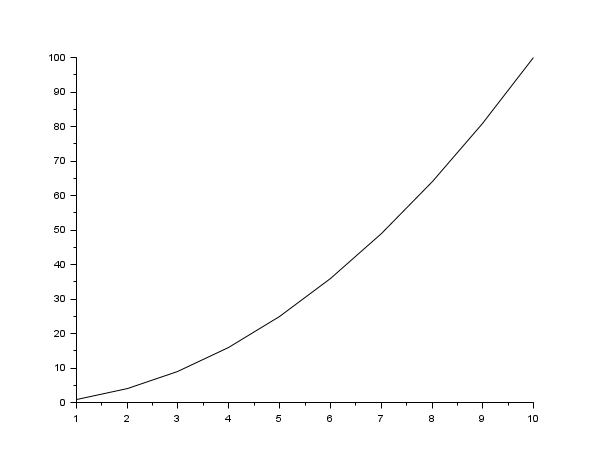
clf
fplot2d(1:10,'parab')
See also
- plot2d — 2D plot
- feval — множественное выполнение
- paramfplot2d — animated plot of a 2D parametrized curve.
History
| Версия | Описание |
| 6.1.1 | fplot2d() is declared obsolete, to be removed from 6.2.x. plot(x,f) replaces it. |
| Report an issue | ||
| << fgrayplot | 2d_plot | grayplot >> |