airy
Airy functions of the first and second kind, and their derivatives
Syntax
a = airy(z)
a = airy(fun, z)
a = airy(fun, z, scaled)
Arguments
- z
- array of decimal or complex numbers of any size, from scalr to hypermatrix.
- fun
- Selected Airy function to evaluate. It can be either a string among
"Ai" "dAi" "Bi" "dBi", or an equivalent integer in [0, 3] (for compatibility
with Octave and Julia)
fun Description 0 "Ai" Airy function of the first kind (default) 1 "dAi" Derivative Ai' of Ai 2 "Bi" Airy function of the second kind 3 "dBi" Derivative Bi' of Bi - scaled
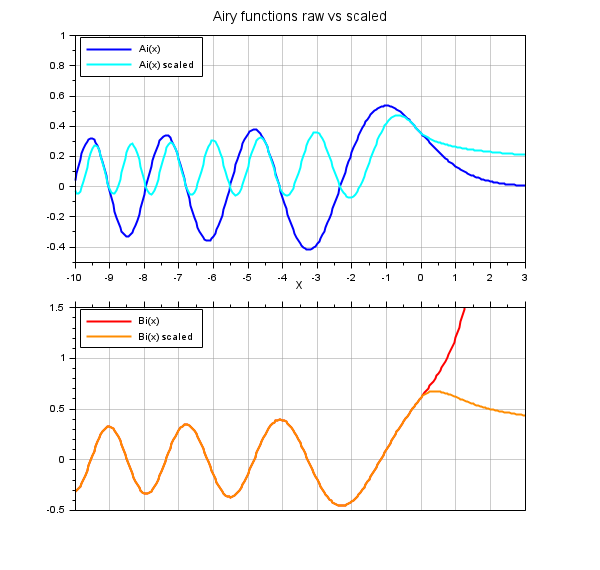
- Single boolean or integer 0|1. Default %F. When
scaledis %T or set to 1, the raw result is scaled by the following factors before being returned:Ai, dAi : 
Bi, dBi : 
Description
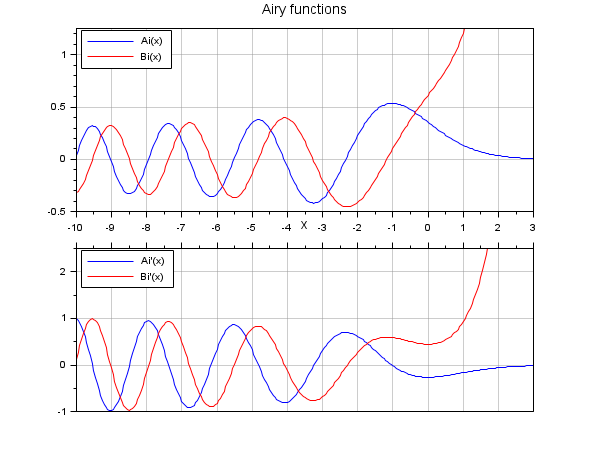
For a real x variable, the Airy functions of the first and second kind -- respectively Ai(x) and Bi(x) -- are independent real solutions y(x) of the Airy differential equation y'' = x.y. They are defined as the convergent integrals

![Bi(x) = 1/π \int_0^∞ [sin(t^3/3 + xt) + exp(-t^3/3 + xt)] dt](/docs/2023.0.0/ru_RU/_LaTeX_airy.xml_4.png)
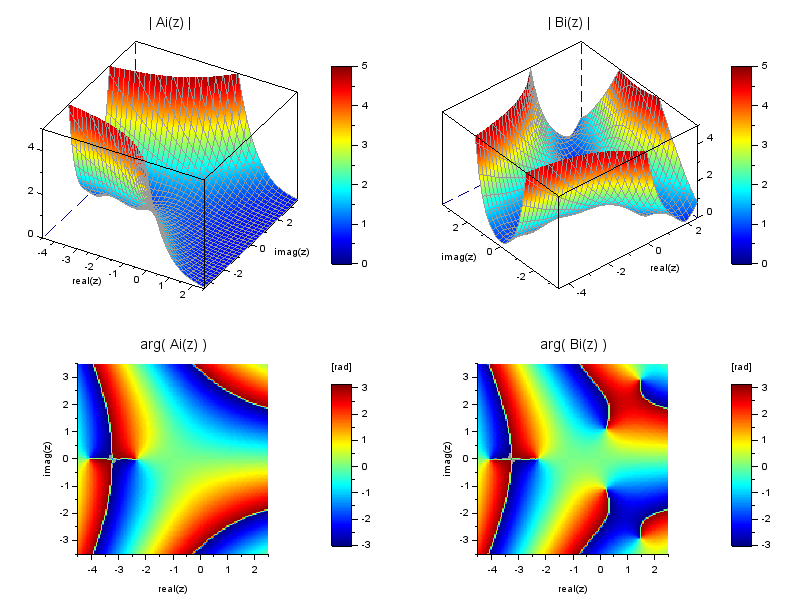
These definitions can be extended to the complex plane, for any z complex variable, as

Let us note the properties

In Scilab, Ai, Bi, and their first derivative are computed through Bessel and gamma functions.
Examples
With real numbers
x = -10:0.05:3;
clf
drawlater

subplot(2,1,1)  // Ai, Bi
plot(x, airy(x), "b", x, airy(2,x), "r")
gca().margins(4) = 0.08;
gca().data_bounds(3:4) = [-0.5 1.25];
gca().tight_limits = "on";
xgrid(color("grey60"),1,7)
legend(["Ai(x)" "Bi(x)"],"in_upper_left")
title("Airy functions", "fontsize", 3)

subplot(2,1,2)  // Derivatives
plot(x, airy(1, x), "b", x, airy(3,x), "r")
legend(["Ai''(x)" "Bi''(x)"],"in_upper_left")
xlabel("x", "fontsize", 3)
gca().margins(3) = 0.08;
gca().x_location = "top";
gca().x_ticks.labels = emptystr(gca().x_ticks.labels);
gca().data_bounds(3:4) = [-1 2.5];
gca().tight_limits = "on";
xgrid(color("grey60"),1,7)

drawnow
With scaling
x = -10:0.05:3;
clf
drawlater

subplot(2,1,1)  // Ai, Ai scaled
plot(x, airy("Ai",x), x, airy("Ai",x, %t), "color", ["blue" "cyan"])
gca().margins(4) = 0.08;
gca().data_bounds(3:4) = [-0.5 1];
gca().tight_limits = "on";
xgrid(color("grey60"),1,7)
legend(["Ai(x)" "Ai(x) scaled"],"in_upper_left")
title("Airy functions raw vs scaled", "fontsize", 3)

subplot(2,1,2)  // Bi, Bi scaled
plot(x, airy("Bi", x), x, airy("Bi",x, %t), "color", ["red" "darkorange"])
legend(["Bi(x)" "Bi(x) scaled"],"in_upper_left")
xlabel("x", "fontsize", 3)
gca().margins(3) = 0.08;
gca().x_location = "top";
gca().x_ticks.labels = emptystr(gca().x_ticks.labels);
gca().data_bounds(3:4) = [-0.5 1.5];
gca().tight_limits = "on";
xgrid(color("grey60"),1,7)

gcf().children.children.children.thickness = 2;
drawnow
With complex numbers
// Initializations
x = -4.5:0.2:2.5;
y = -3.5:0.2:3.5;
[X, Y] = meshgrid(x, y);
xph = -4.5:0.05:2.5;
yph = -3.5:0.05:3.5;
[Xph, Yph] = meshgrid(xph, yph);
clf
fig = gcf();
drawlater
[nc, cmin] = (100, 15);
fig.color_map = [0.6 0.6 0.6; jetcolormap(nc-1)];
meshColor = 1; // grey60 will be used for the mesh color
fig.axes_size = [800 600];
fr = 0.55;

// |Ai|
xsetech([0 0 0.5 fr])
Z = X + %i*Y;
Z = airy(Z);
V = abs(Z);
[smin, smax] = (0, 5);
surf(x, y, V)
S = gce();
set(S, "color_flag",3, "color_mode",1, ..
       "cdata_mapping","direct", "foreground",meshColor);
c = S.data.color;
c = cmin + (nc-cmin)*(c-smin)/(smax-smin);
S.data.color = c;
gca().zoom_box = [min(x) min(y) max(x) max(y) smin smax];
gca().rotation_angles = [47 -60];
xtitle("", "real(z)","imag(z)", "")
title("| Ai(z) |", "fontsize",3)
colorbar(smin, smax, [2, nc])

// arg(Ai)
xsetech([0 fr 0.5 (1-fr)])
Z = airy(Xph + %i*Yph);
V = atan(imag(Z),real(Z));
grayplot(xph, yph, V.')
xtitle("","real(z)", "imag(z)")
title("arg( Ai(z) )", "fontsize", 3)
gca().tight_limits = "on";
isoview
colorbar(,,[2 nc])
title(fig.children(1), "[rad]")

// |Bi|
xsetech([0.50 0 0.5 fr])
Z = X + %i*Y;
Z = airy(2, Z);
V = abs(Z);
[smin, smax] = (0, 5);
surf(x, y, V)
S = gce();
set(S, "color_flag",3, "color_mode",1, ..
       "cdata_mapping","direct", "foreground",meshColor);
c = S.data.color;
c = cmin + (nc-cmin)*(c-smin)/(smax-smin);
S.data.color = c;
gca().zoom_box = [min(x) min(y) max(x) max(y) smin smax];
gca().rotation_angles = [40 -130];
xtitle("", "real(z)","imag(z)", "")
title("| Bi(z) |", "fontsize",3)
colorbar(smin, smax, [2, nc])

// arg(Bi)
xsetech([0.5 fr 0.5 (1-fr)])
Z = airy(3, Xph + %i*Yph);
V = atan(imag(Z),real(Z));
grayplot(xph, yph, V.')
xtitle("","real(z)", "imag(z)")
title("arg( Bi(z) )", "fontsize", 3)
gca().tight_limits = "on";
isoview
colorbar(,,[2 nc])
title(fig.children(1), "[rad]")

drawnow
History
| Версия | Описание |
| 6.1.0 | airy() introduced. |
| Report an issue | ||
| << %k | Special Functions | amell >> |