hist3d
representação 3d de um histograma (obsoleto)
Seqüência de Chamamento
hist3d(mtx,[theta,alpha,leg,flag,ebox])
hist3d(mtx,<opt_args>)
hist3d(list(mtx,x,y),[theta,alpha,leg,flag,ebox])
hist3d(list(mtx,x,y),<opt_args>)
Parâmetros
- mtx
matriz de tamanho (m,n) definindo o histograma
mtx(i,j)=F(x(i),y(j)), ondexeyasão tomados como0:me0:n.- list(mtx,x,y)
onde f é uma matriz de tamanho (m,n) definindo o histograma
mtx(i,j)=F(x(i),y(j)), com vetoresxeyde tamanho (1,n+1) e (1,m+1).- theta,alpha,leg,flag,ebox
ver
plot3d.
Descrição
 | Up to Scilab 6.0, hist3d() features are actually some
bar3d() ones. In Scilab 6.1.0, bar3d() is
introduced as a clone of hist3d(). From now on, please use
bar3d() in replacement of the former hist3d().
hist3d() will be redefined in Scilab 6.2.0 to actually support 3D
histogram features. |
hist3d representa um histograma 2d como um esboço
3d. Os valores são associados aos intervalos [x(i) x(i+1)[ X
[y(i) y(i+1)[
.
Entre com o comando hist3d() para visualizar uma
demonstração.
Exemplos
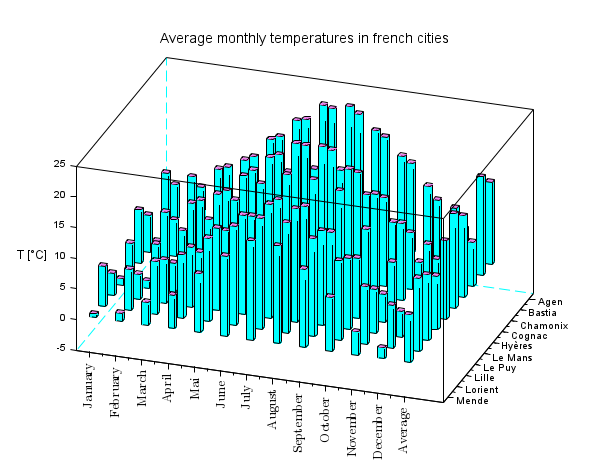
hist3d();
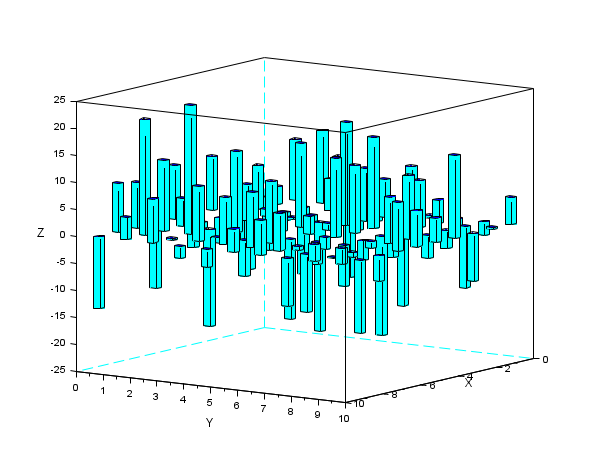
hist3d(grand(10, 10, "nor", 0, 10))
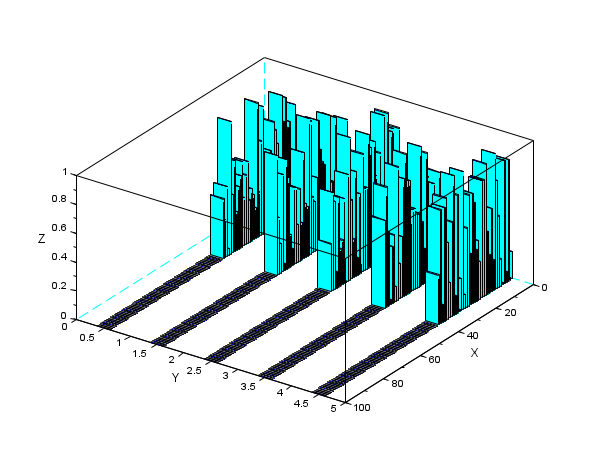
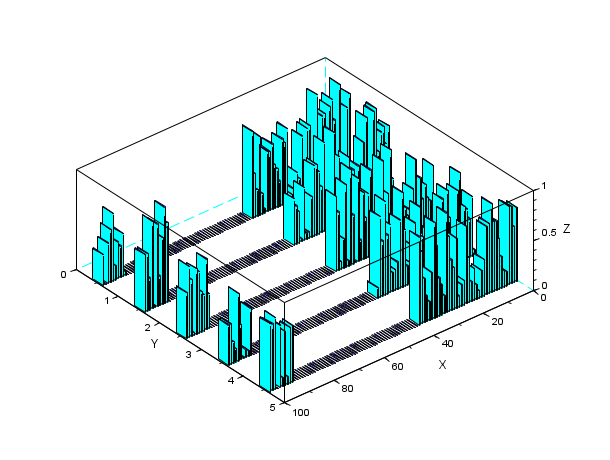
Z = zeros(100,5);
A = abs(rand(40,5));
Z(1:40,:) = A;
Index = find(Z==0);
Z(Index) = %nan;
scf();
hist3d(Z);
isoview off
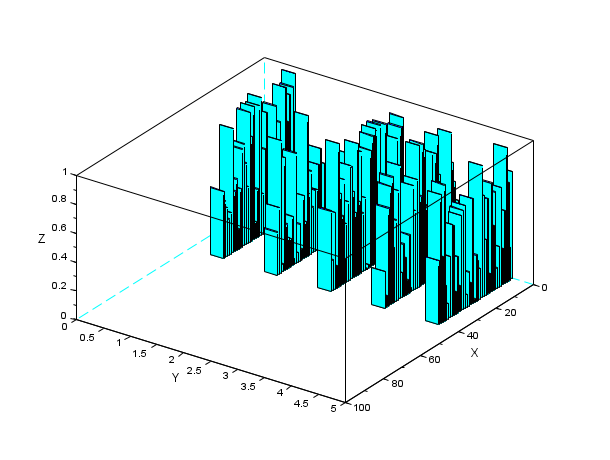
Z = zeros(100,5);
A = abs(rand(40,5));
Z(1:40,:) = A;
A = abs(rand(10,5));
Z(91:100,:) = A;
scf();
hist3d(Z);
isoview off
Histórico
| Versão | Descrição |
| 6.1.0 | The current implementation of hist3d() is declared obsolete. Use bar3d() instead. |
| Report an issue | ||
| << geom3d | 3d_plot | mesh >> |