surface properties
description of the 3D entities properties
Description
The Surface entity is a leaf of the graphics entities hierarchy. Two
classes appears under this type of entity : Plot3d and
Fac3d according to the plotting function or the way data is
entered. Fac3d and Plo3d entities are similar
but Fac3d is more complete and accept more options than
Plot3d. To always have Fac3d entities, simply
use genfac3d to pre-build matrices before using
plot3d or use the surf command.
Here are the properties contained in a surface entity:
- parent:
This property contains the handle of the parent. The parent of the surface entity should be of type
"Axes"or"Compound".- children:
This property contains a vector with the
childrenof the handle. However, surface handles currently do not have anychildren.- visible:
- "on" (default): The surface is displayed, possibly with its mesh and markers.
- "off" : The surface and its mesh and markers are hidden.
- surface_mode:
- "on" (default): facets (body and edges) are drawn.
- "off" : facets (body and edges)
are hidden. But markers -- if any -- are still displayed
(provided that
.mark_mode = "on").
- foreground:
If
color_mode >= 0, this field contains the color index used to draw the edges. If not, foreground is not used at all. The foreground value should be an integer color index (relative to the current colormap).- thickness:
This property is a positive real specifying the width of facets contours in pixels. The displayed width is actually determined by rounding the supplied width to the nearest integer. The only exception is vectorial export where the whole
thicknessvalue is considered.- mark_mode:
This field contains the default
mark_modeproperty value for the surface. Its value should be"on"(marks drawn) or"off"(no marks drawn).- mark_style:
The
mark_styleproperty value is used to select the type of mark to use whenmark_modeproperty is"on". The value should be an integer in [0 14] which stands for: dot, plus, cross, star, filled diamond, diamond, triangle up, triangle down, diamond plus, circle, asterisk, square, triangle right, triangle left and pentagram.The figure below shows the aspects of the marks depending on themark_styleand themark_foregroundandmark_backgroundproperties.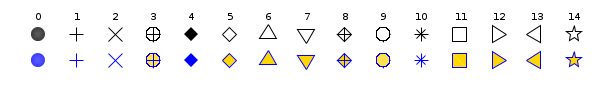
- mark_size_unit:
This field contains the default
mark_size_unitproperty value. Ifmark_size_unitis set to"point", then themark_sizevalue is directly given in points. Whenmark_size_unitis set to"tabulated",mark_sizeis computed relative to the font size array: therefore, its value should be an integer in [0 5] which stands for 8pt, 10pt, 12pt, 14pt, 18pt and 24pt. Note that plot3d and pure scilab functions usetabulatedmode as default ; when using the surf (or plot for 2D lines) function, thepointmode is automatically enabled.- mark_size:
The
mark_sizeproperty is used to select the type of size of the marks whenmark_modeproperty is"on". Its value should be an integer between 0 and 5 which stands for 8pt, 10pt, 12pt, 14pt, 18pt and 24pt.- mark_foreground:
This field contains the
mark_foregroundproperty value which is the marks' edge color. Its value should be a color index (relative to the current color_map) or 0 for transparent edge.- mark_background:
This field contains the
mark_backgroundproperty value which is the marks' face color. Its value should be a color index (relative to the current color_map) or 0 for transparent face.- data:
This field defines a
tlistdata structure of type "3d" composed of a row and column indices of each element as the x-, y- and z-coordinates contained respectively indata.x,data.yanddata.z. The complementary field nameddata.coloris available in case a real color vector or matrix is specified. If none,data.coloris not listed. The surface is painted according tocolor_modeandcolor_flagproperties.- color_mode:
color index in
[-size(colormap), size(colormap)]If color_flag == 0 : The uniform color of the whole upward surface is set to the index
abs(color_mode).In addition, whatever is
color_flag,color_mode = 0makes facets hollow and displays only the surface's mesh.color_mode > 0displays facets bodies and edges.color_mode < 0hides the mesh and displays only facets bodies.
When it is displayed, the mesh color is set to
foreground.- color_flag:
Chooses the algorithm used to set the color of the body of the upward face of facets, when it is displayed.
In addition,
color_moderules the display of the mesh (facets edges) and/or body of facets.foregroundandthicknessrules the line color and thickness of the mesh.hiddencolorrules the color of the backward facets face.
Here below,
- nf stands for the number of facets of the surface.
- n stands for the number of vertices of each facet. All facets have the same number of vertices.
color_flag = 0 (uniform color) :
All facets are painted using the same color index and method defined by
color_mode(see above).color_flag = 1 (uniform color on each facet, mapping Z) :
The average Z of each facet is computed according to the Z of its vertices. Then the [Zmin, Zmax] range of facets Z is computed. Each facet gets its uniform color in [1, size(colormap)] according to its Z position in [Zmin, Zmax].
color_flag== 2,3 or 4 values are only available with
Fac3dentities. These algorithms require thedata.colorinput to set facets colors. Ifdata.coloris empty, thecolor_flag=1fallback algorithm is used.color_flag = 2 ('flat' shading) :
All facets are painted using the color index given in the
data.colorproperty (one color per facet is needed). Two cases are then possible :data.coloris a vector of as manycolorindices as there are facets,color(i)being the color index for the facet#i:color(i)>0: the boundary of the facet is drawn with current line style and color.color(i)<0: the facet's boundary is not drawn, and-color(i)is used as facet's color.
data.coloris a matrix of color indices, of size (n,nf). Then, the actual color index of the facet is set to the average color of all its vertices.
color_flag = 3 (interpolated shading on each facet) :
Facets painting is done by interpolating their vertices colors. The indices of vertices color are given in the
data.colorproperty (one color per vertex is needed). Two cases are possible :data.coloris a vector ofnfcolorindices,color(i)being the index of the flat uniform color of the facet#i.data.coloris a color matrix of size (n,nf): The facet #i is drawn with some graded colors interpolated between thecolor(:,i)colors of its vertices. If the Z coordinate of vertices has been assigned to
data.color, this mode allows to map local Z with colors, down to the facet scale. See also the.cdata_mappingproperty.
color_flag = 4 (Matlab-like 'flat' shading) :
Same as
color_flag==2, except that, whendata.coloris a color matrix, each facet #i is painted with the uniformcolor(1,i)of its first vertex (instead of the average color of all its vertices). Other vertices colors are ignored.
- cdata_mapping:
'scaled'or'direct'. Used only forcolor_flag=2|3|4(Fac3dhandles), with somedata.colordefined. Otherwise ignored."direct":
data.colorvalues are directly considered as color indices in the current gcf().color_map."scaled":
c=data.colorvalues are linearly mapped on the interval[1,nC], withnC=size(gcf().color_map,1)is the total number of colors in the current colormap. Then,min(c)represents the color #1, andmax(c)represents the color #nC.
- hiddencolor:
Positive index of the color of the uniform backward faces of all facets. If a negative or null value is provided, backward faces are painted with the same respective colors as the upward visible ones.
- clip_state:
This field contains the
clip_stateproperty value for the surface. It should be :"off"this means that the surface is not clipped."clipgrf"this means that the surface is clipped outside the Axes box."on"this means that the surface is clipped outside the rectangle given by property clip_box.
- clip_box:
This field is to determinate the
clip_boxproperty. By Default its value should be an empty matrix if clip_state is "off". Other cases the vector[x,y,w,h](upper-left point width height) defines the portions of the surface to display, howeverclip_stateproperty value will be changed.- use_color_material:
This field is use to enable the use of the surface color as diffuse color. Its default value is
"on".- material_shininess:
This field defines the shininess level of the surface. This parameter controls the shinines color spreading in the surface. Any positive value can be used. Good values to use are in the [0 10] range, where low values generates strong highlight and high values generates barely perceptible highlights. The default value is
"2".- ambient_color:
This field defines the ambient color of the surface. The color is defined by a 3 element vector
"[red, green, blue]"with each element in the range [0, 1]. The default value is"[1 1 1]".- diffuse_color:
This field defines the diffuse color of the surface. The color is defined by a 3 element vector
"[red, green, blue]"with each element in the range [0, 1]. Notice that this field is only used when use_color_material is disabled. The default value is"[1 1 1]".- specular_color:
This field defines the specular color of the surface. The color is defined by a 3 element vector
"[red, green, blue]"with each element in the range [0, 1]. The default value is"[1 1 1]".- user_data:
This field can be use to store any scilab variable in the surface data structure, and to retrieve it.
Examples
//create a figure
t=[0:0.3:2*%pi]'; z=sin(t)*cos(t');
[xx,yy,zz]=genfac3d(t,t,z);
plot3d([xx xx],[yy yy],list([zz zz+4],[4*ones(1,400) 5*ones(1,400)]))
h=get("hdl") //get handle on current entity (here the surface)
a=gca(); //get current axes
a.rotation_angles=[40,70];
a.grid=[1 1 1];
//make grids
a.data_bounds=[-6,0,-1;6,6,5];
a.axes_visible="off";
//axes are hidden a.axes_bounds=[.2 0 1 1];
f=get("current_figure");
//get the handle of the parent figure
f.color_map=hotcolormap(64);
//change the figure colormap
h.color_flag=1;
//color according to z
h.color_mode=-2;
//remove the facets boundary
h.color_flag=2;
//color according to given colors
h.data.color=[1+modulo(1:400,64),1+modulo(1:400,64)];
//shaded
h.color_flag=3;

scf(2); // creates second window and use surf command
subplot(211)
surf(z,'cdata_mapping','direct','facecol','interp')

subplot(212)
surf(t,t,z,'edgeco','b','marker','d','markersiz',9,'markeredg','red','markerfac','k')
e=gce();
e.color_flag=1 // color index proportional to altitude (z coord.)
e.color_flag=2; // back to default mode
e.color_flag= 3; // interpolated shading mode (based on blue default color because field data.color is not filled)
See also
- set — Ajusta um valor de propriedade de uma objeto entidade gráfica ou de um objeto Interface do Usuário (User Interface)
- get — Gets the handle of a graphical or User Interface object, or the property's value of objects.
- delete — Deleta uma entidade gráfica e seus galhos
- plot3d — esboço 3d de uma superfície
- plot3d1 — Esboço 3d em níveis de cinza ou de cores de uma superfície
- plot3d2 — Esboço de superfície definida por facetas retangulares
- surf — Esboço de superfície 3d
- grayplot_properties — description of the grayplot entities properties
- Matplot_properties — Description of the Matplot entities properties
- graphics_entities — Descrição das estruturas de dados de entidades gráficas
| Report an issue | ||
| << surf | 3d_plot | annotation >> |