Scilab-Branch-6.1-GIT
Please note that the recommended version of Scilab is 2026.1.0. This page might be outdated.
See the recommended documentation of this function
meshgrid
Cria matrizes ou arrays 3-D a partir de vetores replicados em 2 ou 3 dimensões
Seqüência de Chamamento
U = meshgrid(u)
[U, V] = meshgrid(u)
[X, Y] = meshgrid(x, y)
[X, Y, Z] = meshgrid(x, y, z)
Parâmetros
- u, x, y, z
- Vetores de qualquer tipo, de comprimento nx, ny, nz.
- U, V
- Matrizes quadradas de tamanho nu x nu
- X, Y, Z
- Matrizes ou hipermatrizes do mesmo tamanho [ny, nx] ou [ny, nx, nz].
Descrição
meshgrid (..) constrói matrizes ou matrizes 3D replicando vetores de entrada ao longo de 2 ou 3 dimensões.
 | To create arrays of size [nx, ny] instead of
[ny, nx], or with more than 3 dimensions, please use
ndgrid(x, y) or ndgrid(x, y, z,..). |
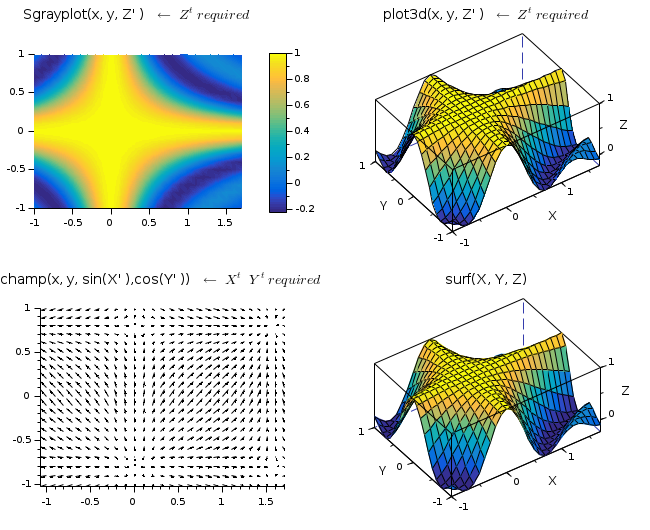
 | Most of Scilab 2D or 3D graphical functions like champ(),
grayplot(), Sgrayplot(),
plot3d(), contour(), etc.. work with grids
generated with ndgrid(), not from
meshgrid(). Data computed on grids coming from
meshgrid() will require being transposed (please see the
example thereafter). |
Exemplos
[X, Y] = meshgrid(0:2)
--> [X, Y] = meshgrid(0:2)
 X  =
   0.   1.   2.
   0.   1.   2.
   0.   1.   2.

 Y  =
   0.   0.   0.
   1.   1.   1.
   2.   2.   2.
[X, Y] = meshgrid(["a" "bc" "αβγδ"], [-3 5])
--> [X, Y] = meshgrid(["a" "bc" "αβγδ"], [-3 5])
 X  =
!a  bc  αβγδ  !
!a  bc  αβγδ  !

 Y  =
  -3.  -3.  -3.
   5.   5.   5.
Application to grids for graphics:
// Generating data
x = -1:0.1:1.7;
y = -1:0.1:1;
[X, Y] = meshgrid(x, y);
Z = sinc(2*%pi * X.*Y);

// Setting the graphic figure
clf
drawlater
gcf().color_map = parulacolormap(64);
gcf().axes_size = [650 530];

// Plotting
subplot(2,2,1)
Sgrayplot(x, y, Z')
title(["Sgrayplot(x, y, Z'' ) " "$←\;Z^t\; required$"], "fontsize",3)
isoview, colorbar

subplot(2,2,2)
plot3d(x, y, Z', -125,50)
gce().color_flag = 1;
title(["plot3d(x, y, Z'' ) " "$←\;Z^t\; required$"], "fontsize",3)
isoview

subplot(2,2,3)
champ(x,y,sin(2*X'),cos(2*Y'))
title(["champ(x, y, sin(X'' ),cos(Y'' ))" "$←\;X^t\;\;Y^t\; required$"], "fontsize",3)
isoview

subplot(2,2,4)
surf(X, Y, Z)
title("surf(X, Y, Z)", "fontsize",3)
isoview

gcf().children.tight_limits = ["on" "on" "on"];
drawnow
Ver Também
| Report an issue | ||
| << logspace | Elementary matrices | ndgrid >> |