Scilab-Branch-6.1-GIT
Please note that the recommended version of Scilab is 2026.1.0. This page might be outdated.
See the recommended documentation of this function
nicholschart
ニコルス線図
呼び出し手順
sh = nicholschart(modules)
sh = nicholschart(modules, args)
sh = nicholschart(modules, args, colors)
引数
- modules
- 実数ベクトル: モジュール (単位: dB). Default values:
[-30:-10:Modmin -20 -15 -12 -9 -6 -3 -2 -1 -.5 -0.2 -0.1 0 0.1 0.2 0.5 1 2 3 6 12] - args
- r実数ベクトル: 位相 (単位: 度). Default values:
-[1 2 5 10 20 30 50 70 90 120 140 160 180]° - colors
- vector of 1 or 2 components specifying the colors of the isogain and isophase
sets of curves. If a single color is provided, it is used for both gains and
phases. colors may be specified either
- by indices in the color map.
- named colors among the predefined ones.
- "#RRGGBB" hexadecimal case-insensitive strings starting with "#", like "#FA7B35".
- A 1x3 or 2x3 matrix of [r g b] intensities with 0 <= r,g,b <= 1.
- sh
Structure with 3 fields:
.phaseLines: vector of handles of isophase lines..phaseLines(i)is the line forargs(i)..gainLines: vector of handles of isogain lines..gainLines(i)is the line formodules(i)..gainLabels: vector of handles of isogain labels..gainLabels(i)is the label formodules(i).
説明
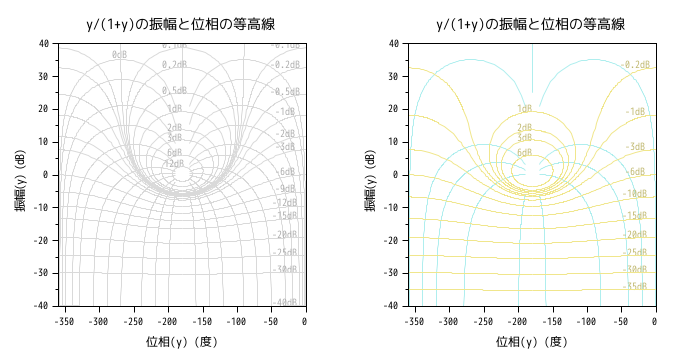
ニコルス線図をプロット: yの位相/ゲイン平面への
y/(1+y)の等モジュールおよび等引数等高線をプロット
nicholschart は,black
と組み合わせて使用することができます.
 | To use the default value of an input argument, just skip it, as in
nicholschart(modules,,colors). |
例
//ニコルス線図
clf
subplot(1,2,1)
nicholschart();

subplot(1,2,2)
mod = [-35:5:-10 -6 -3 -1 -0.2 1 2 3 6];
nicholschart(mod, -[1 20 40 80 160 180],["khaki" "paleturquoise"]);
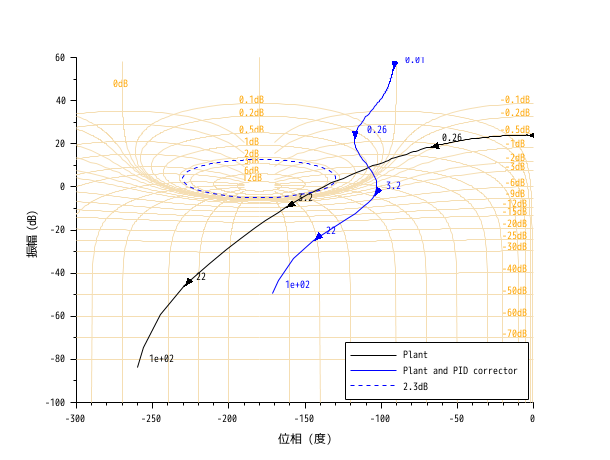
//ニコルス線図のグリッドを付けたブラック図
s = poly(0,'s');
Plant=syslin('c',16000/((s+1)*(s+10)*(s+100)));

// 2自由度PID
tau = 0.2;
xsi = 1.2;
PID = syslin('c',(1/(2*xsi*tau*s))*(1+2*xsi*tau*s+tau^2*s^2));
clf
black([Plant;Plant*PID ],0.01,100,["Plant";"Plant and PID corrector"]);

// 右下隅にキャプションを移動
gca().children(1).legend_location="in_lower_right";
h = nicholschart(,,'wheat');
h.gainLabels.font_foreground = color("orange");
参照
履歴
| バージョン | 記述 |
| 5.5.0 | 使用可能な呼び出し手順: nicholschart(gains, phases, colors). |
| 6.1.0 |
|
| Report an issue | ||
| << hallchart | Frequency Domain | nyquist >> |