Scilab-Branch-6.1-GIT
Please note that the recommended version of Scilab is 2026.1.0. This page might be outdated.
See the recommended documentation of this function
gainplot
magnitude plot
Syntax
gainplot(sl, fmin, fmax)
gainplot(sl, fmin, fmax, step)
gainplot(frq, db, phi)
gainplot(frq, repf)
gainplot(.., comments)
Arguments
- sl
A siso or simo linear dynamical system, in state space, transfer function or zpk representations, in continuous or discrete time.
- fmin,fmax
real scalars (frequency interval).
- step
real (discretization step (logarithmic scale))
- comments
string
- frq
matrix (row by row frequencies)
- db,phi
matrices (magnitudes and phases corresponding to
frq)- repf
complex matrix. One row for each frequency response.
Description
Same as bode but plots only the magnitude.
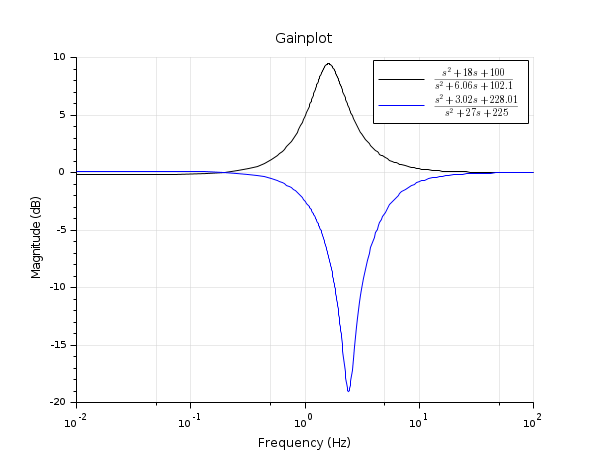
Examples
s=poly(0,'s')
h1=syslin('c',(s^2+2*0.9*10*s+100)/(s^2+2*0.3*10.1*s+102.01))
h2=syslin('c',(s^2+2*0.1*15.1*s+228.01)/(s^2+2*0.9*15*s+225))
clf();gainplot([h1;h2],0.01,100,..
                   ["$\frac{s^2+18 s+100}{s^2+6.06 s+102.1}$";
                    "$\frac{s^2+3.02 s+228.01}{s^2+27 s+225}$"])
title('Gainplot')
See also
History
| Version | Description |
| 6.0 | handling zpk representation |
| Report an issue | ||
| << freson | Frequency Domain | hallchart >> |