Please note that the recommended version of Scilab is 2026.0.0. This page might be outdated.
See the recommended documentation of this function
sgrid
s平面のグリッド線.
呼び出し手順
sgrid()
sgrid(zeta, wn)
sgrid(.., colors)
sgrid(.., "new")
引数
- zeta
ダンピング係数の配列.
[0
                            1]
の範囲の値が有効です. デフォルト値はcosd(90:-10:0) ~[0 0.17 0.34 0.5 0.64 0.77 0.87 0.94 0.985 1]です.- wn
固有周波数の配列(単位:Hz). 正の値のみが有効です. 省略された場合,プロットの境界に適合するように プログラムにより計算されます.
- colors
整数値(色添字)を有するスカラーまたは2要素の配列.
説明
evansと組み合わせて使用され,
ダンピング比(zeta),
固有周波数 (wn)が一定値となる
線をプロットします.
引数colors は,
ダンピング係数が一定の曲線(colors(2)) および
固有周波数が一定の曲線(colors(1))の色を指定します.
sgrid関数は,連続時間線形システムの根軌跡の
グリッドを描画する際によく使用されます.
この場合,sgrid関数は
evansをコールした後に
コールする必要があります.
離散時間線形システムの場合,zgrid
関数を使用する必要があります.
オプション引数 'new' は,
グリッドをプロットする前にグラフィックウィンドウを消去する
ために使用できます.
例

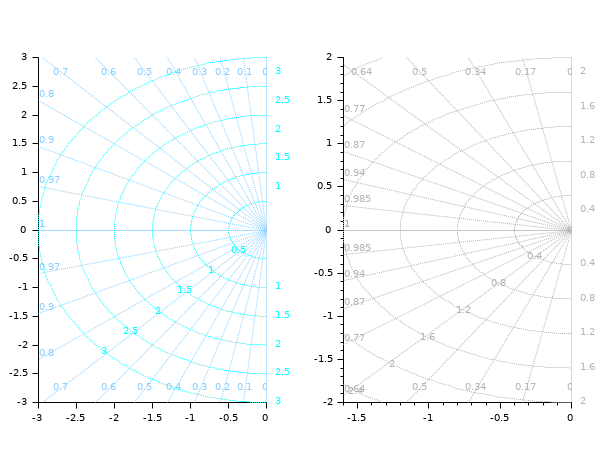
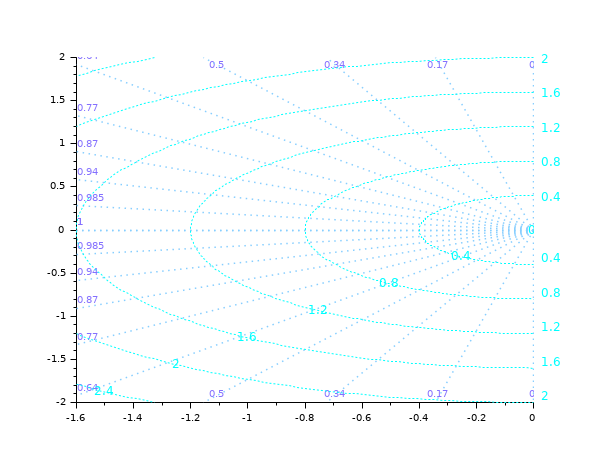
Post-tuning graphical elements of the grid:
sgrid()

sGrid = gca().children.children.children;
i = find(sGrid(3:$).type=="Polyline" & sGrid(1:$-2).type=="Polyline",1);

Circles = sGrid(1:i-1);
Circ_text = Circles(Circles.type=="Text");      // Labels
Circ_text.font_size = 2;
Circ_lines = Circles(Circles.type=="Polyline"); // Circles
Circ_lines.line_style = 8;

Rays = sGrid(i:$);
Rays(Rays.type=="Text").font_foreground = color("light slate blue");
Rays_lines = Rays(Rays.type=="Polyline");
set(Rays_lines, "line_style", 9, "thickness", 1.5);

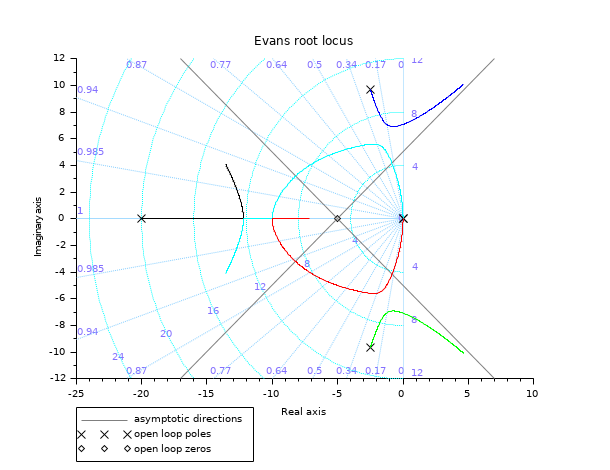
Evans plot + an s grid:
H = syslin('c',352*poly(-5,'s')/poly([0,0,2000,200,25,1],'s','c'));
clf
evans(H,100)
sgrid()

// All labels in violet
sGrid = gca().children.children.children;
sGrid(sGrid.type=="Text").font_foreground = color("light slate blue");

参照
- evans — エバンス根軌跡
- zgrid — zgrid プロット
- hallchart — Draws a Hall chart
- nicholschart — ニコルス線図
履歴
| Version | Description |
| 6.0.2 | colors can be specified by their names or by their #RRGGBB code |
| Report an issue | ||
| << routh_t | Stability | show_margins >> |