Please note that the recommended version of Scilab is 2026.1.0. This page might be outdated.
See the recommended documentation of this function
mesh2d
Triangulation of n points in the plane
Calling Sequence
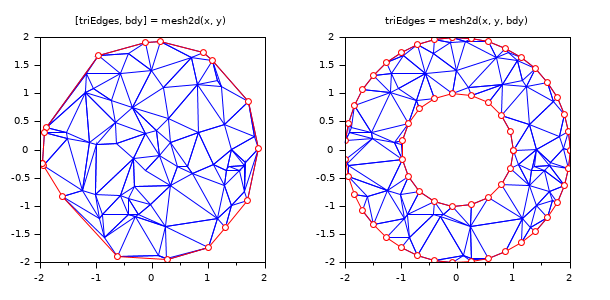
triEdges = mesh2d(x, y)
[triEdges, bdy] = mesh2d(x, y)
triEdges = mesh2d(x, y, bdy)
Parameters
- x
real vector
- y
real vector
- bdy
integer vector
- triEdges
integer matrix
Description
mesh2d computes a triangulation of n points in the plane with coordinates given by vectorsx,y. It
returns a matrix triEdges of size [3,nbt] where triEdges(:,i) gives the vertices numbers of triangle #i and nbt is the number of triangles.
When bdy is given as an input parameter this vector defines the
boundary and contains the indices of edges belonging to it, grouped by successive connected components. Each component is positively oriented, i.e. successive bdy(i:i+1) segments have the interior of the domain to their left. Hence, for a simply connected domain, the boundary is given counterclockwise, and eventual holes are always given clockwise.
Each connected component must be closed and is represented by the vector [i1,..,i_nc] such that
i1 == i_nc.
When bdy is given as an output parameter the boundary is computed prior to the triangulation as the convex hull of input points x,y and is returned in bdy with the same convention as above, i.e. counterclockwise sucessive vertices numbers.
Possible error cases are the following:
Warning
The triangulation computed by mesh2d is not guaranteed to be a Delaunay triangulation of points (x,y).
Examples
function displayTri(X, Y, Tr)
  plot(0,0,rect=[-1 -1 2 2])
  [m, n] = size(Tr);
  xpols = matrix(X(Tr), m, n);
  ypols = matrix(Y(Tr), m, n);
  xpolys(xpols, ypols, color("blue")*ones(n,1));
endfunction

r1 = 1;
n1 = 20;
u = linspace(2*%pi, 0, n1);
xc1 = r1*cos(u(1:$-1));
yc1 = r1*sin(u(1:$-1));
bdy1 = [1:n1-1, 1];

r2 = 2;
n2 = 40;
v = linspace(0, 2*%pi, n2);
xc2 = r2*cos(v(1:$-1));
yc2 = r2*sin(v(1:$-1));
bdy2 = n1-1+[1:n2-1, 1];

xr = (rand(1, 100)-.5)*2*r2;
yr = (rand(1, 100)-.5)*2*r2;
r = sqrt(xr.^2+yr.^2);

clf
gcf().position(4)=300

// [t, bdy] = mesh2d(x, y) syntax
subplot(1, 2, 1)
k = find(r <= r2);
[t, bdy] = mesh2d(xr(k), yr(k));
displayTri(xr(k), yr(k), t)
plot(xr(k(bdy)), yr(k(bdy)),"r-o")
xtitle("[triEdges, bdy] = mesh2d(x, y)")
isoview

// t = mesh2d(x, y, bdy) syntax
subplot(1, 2, 2)
k = find((r >=  r1) & (r <=  r2));
x = [xc1 xc2 xr(k)];
y = [yc1 yc2 yr(k)];
t = mesh2d(x, y, [bdy1 bdy2]);
displayTri(x, y, t)
plot(x(bdy1), y(bdy1),"r-o")
plot(x(bdy2), y(bdy2),"r-o")
xtitle("triEdges = mesh2d(x, y, bdy)")
isoview
References
mesh2d was previously part of the metanet ATOMS module.
| Report an issue | ||
| << lsq_splin | Interpolation | smooth >> |