Please note that the recommended version of Scilab is 2026.1.0. This page might be outdated.
See the recommended documentation of this function
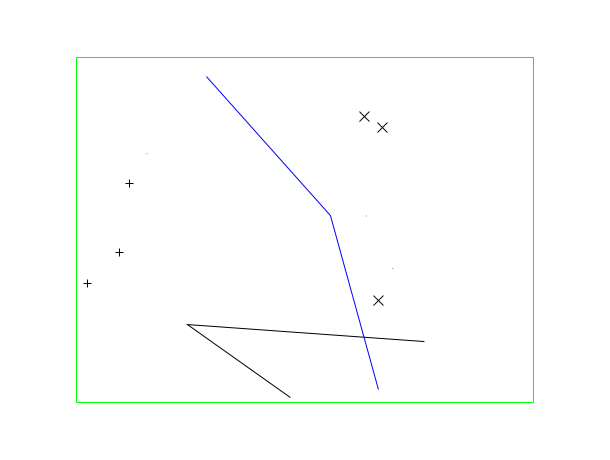
xpolys
一連のポリラインまたはポリゴンを描画
呼び出し手順
xpolys(xpols,ypols,[draw])
引数
- xpols,ypols
同じ大きさの行列 (p,n) (ポリラインの点).
- draw
大きさnのベクトル.
説明
xpolys はマーカまたは破線を用いて
一連のポリラインを描画します.
各ポリラインの座標は
xpols および ypolsの列に保存されます.
ポリライン iの形式は draw(i)により以下のように指定されます:
draw(i)が負の場合, ID-draw(i)を 有するマーカがポリライン i を描画する際に使用されます (マーカはカレントのパターンにより描画されます). See the polyline properties to see ids of available marks.draw(i)が厳密に正の場合,IDdraw(i)の 線の種類(または色)がポリライン i に使用されます. See the polyline properties to see ids of available line styles.
例
plot2d(0,0,-1,"012"," ",[0,0,1,1])

rand("uniform")

gca().foreground = 3;

xpolys(rand(3,5),rand(3,5),[-1,-2,0,1,2])
| Report an issue | ||
| << xpoly | polygon | xrpoly >> |