Please note that the recommended version of Scilab is 2026.1.0. This page might be outdated.
See the recommended documentation of this function
xfpolys
一連のポリゴンを塗りつぶす
呼び出し手順
xfpolys(xpols,ypols,[fill])
引数
- xpols,ypols
同じ大きさ (p,n) (ポリゴンの点)の行列.
- fill
大きさ n または大きさ (p,n)のベクトル
説明
xfpolysは
行列xpols およびypols
で定義された同じ大きさの一連のポリゴンを塗りつぶします.
各ポリゴンの座標はxpols および ypols
の列に保存されます.
ポリゴンは指定した色で塗られるか(フラット),もしくは, 補間色(影付き)で塗られます.
- フラット彩色
この場合,
fillは 大きさnのベクトルとなります. ポリゴン番号 i を塗るパターンはfill(i)で指定されます:fill(i)<0の場合, ポリゴンは パターンID-fill(i)で塗られます.fill(i)=0の場合, ポリゴンは カレントの破線(またはカレントの色)で描画され, 塗られません.fill(i)>0の場合, ポリゴンはパターンIDfill(i)で 塗られます. この後, 等高線がカレントの破線(または色)が描画され, および必要に応じて閉じられます.
- 補間色彩色
この場合,
fillは,xpolsおよびypolsと 同じ大きさの行列となります.pは 3 または 4とします.fill(k,i)はポリゴンiのk番目の縁の色を指定します.
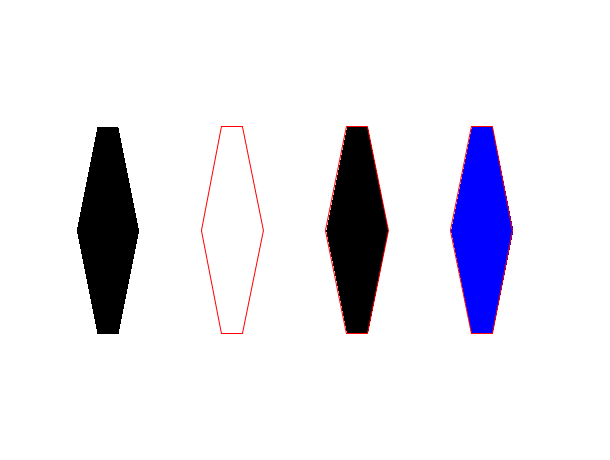
例
a=gca();
a.data_bounds=[0,-10;210,40];
a.foreground=color('red');
x1=[0,10,20,30,20,10,0]';
y1=[15,30,30,15,0,0,15]';
xpols=[x1 x1 x1 x1];
xpols=xpols+[0,60,120,180].*.ones(x1);
ypols=[y1 y1 y1 y1];
xfpolys(xpols,ypols,[-1,0,1,2])
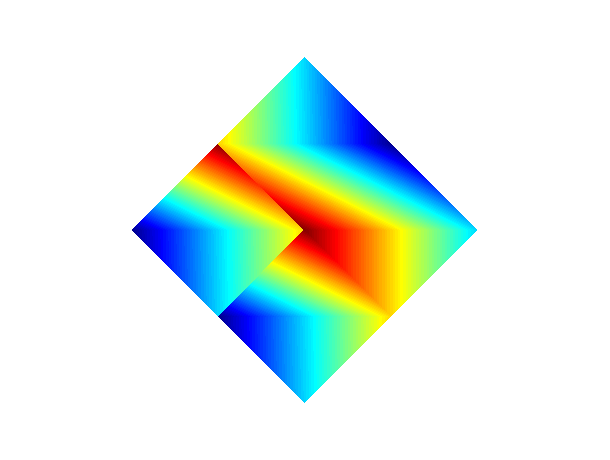
// 補間色
clf()
f=gcf();
a=gca();
a.data_bounds=[0,-10;40,30];
isoview();
x1=[0,10,20,10]';
y1=[10,0,10,20]';
c=linspace(2,100,4)';
xpols=[x1 x1+20 x1+10 x1+10];
ypols=[y1 y1    y1+10 y1-10];
cols= [c c($:-1:1) c([3 4 1 2]) c]
f.color_map=jetcolormap(max(cols));
xfpolys(xpols,ypols,cols)
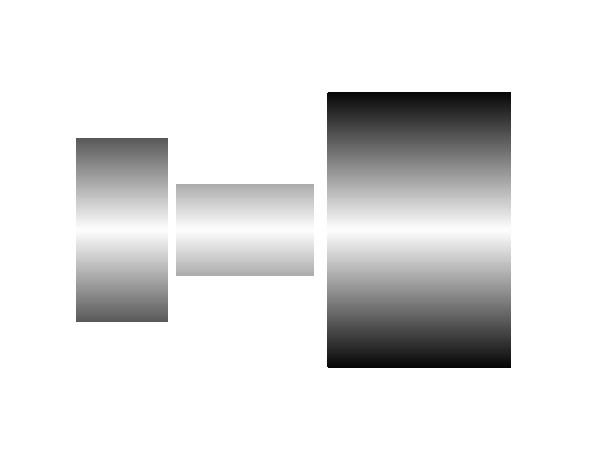
// 補間色
clf()
f=gcf();
x11=[0;20;20;0];
y11=[10;10;30;30];
c11=[10;10;30;30];
x12=x11;
y12=y11+20;
c12=[20;20;1;1];
c12=[30;30;10;10];
x21=[0;30;30;0]+22;
y21=[20;20;30;30];
c21=[20;20;30;30];
x22=x21;
y22=y21+10;
c22=[30;30;20;20];
x31=[0;40;40;0]+55;
y31=[0;0;30;30];
c31=[0;0;30;30];
x32=x31;
y32=y31+30;
c32=[30;30;0;0];
X=[x11 x12 x21 x22 x31 x32];
Y=[y11 y12 y21 y22 y31 y32];
C=([c11 c12 c21 c22 c31 c32]+1)*5;
a=gca();
isoview();
a.data_bounds=[min(X), min(Y); max(X), max(Y)];
f=gcf();
f.color_map=graycolormap(max(C));
xfpolys(X,Y,C)
| Report an issue | ||
| << xfpoly | polygon | xpoly >> |