Please note that the recommended version of Scilab is 2026.1.0. This page might be outdated.
See the recommended documentation of this function
xlabel
sets the x-axis label
ylabel
sets the y-axis label
zlabel
sets the z-axis label
Syntax
xlabel([axes_handle], label, [property_name, property_value,...])
ylabel([axes_handle], label, [property_name, property_value,...])
zlabel([axes_handle], label, [property_name, property_value,...])
Arguments
- label
a string, containing the label value.
- axes_handle
an optional handle, to specify the axes for which the label is set.
- [property_name, property_value,...]
an optional sequence of name-value pairs, to specify the text properties of the label (related to the text properties described here).
The available properties for x-y-zlabel are:
"visible":"on"or"off""fontsize", "font_size": size of font (constant)"fontname", "font_style": ten font names are available (case unsensitive string or related id number): "courrier" | 0, "symbol" | 1, "times" | 2, "times italic" | 3, "times bold" | 4, "times bold italic" | 5, "helvetica" | 6, "helvetica italic" | 7, "helvetica bold" | 8, "helvetica bold italic" | 9."rotation", "font_angle": angle in degrees (constant)"position": position of label (2d vector)"color", "font_foreground": the color of font (a string value chosen among["red","green","blue","cyan","magenta","yellow","black","white"], or a RGB matrix value)"edgecolor", "foreground": the color of line around the text (a string value chosen among["red","green","blue","cyan","magenta","yellow","black","white"], or a RGB matrix value)"backgroundcolor", "background": the color of background around the text (a string value chosen among["red","green","blue","cyan","magenta","yellow","black","white"], or a RGB matrix value)
Description
xlabel, ylabel, zlabel are used to label the x-, y-, and z-axis, respectively.
Each label appears beneath its respective axis in a two-dimensional plot and to the side or beneath the axis in a three-dimensional plot.
Examples
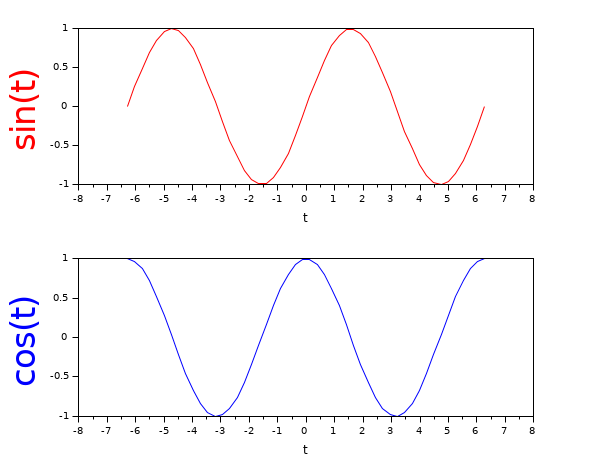
t = linspace(-2*%pi, 2*%pi, 30);

subplot(2,1,1);
plot(t, sin(t), "r");
xlabel("t", "fontsize", 2);
ylabel("sin(t)");
axes_handle = gca();

subplot(2,1,2);
plot(t, cos(t), "b");
xlabel("t", "fontsize", 2);
ylabel("cos(t)", "fontsize", 6, "color", "blue");

ylabel(axes_handle, "sin(t)", "fontsize", 6, "color", "red");
See also
- label_properties — description of the Label entity properties
- xtitle — add titles on a graphics window
- title — display a title on a graphic window
| Report an issue | ||
| << title | annotation | xtitle >> |