Please note that the recommended version of Scilab is 2026.1.0. This page might be outdated.
See the recommended documentation of this function
legend
draw graph legend
Syntax
hl=legend([h,] string1,string2, ... [,pos] [,boxed])
hl=legend([h,] strings [,pos] [,boxed])
Parameters
- h
graphic handle on an Axes entity or vector of handles on polyline entities. The default value is the handle on
current_axes.- string1,string2, ...
character strings
stringiis the legend of the ith curveStarting from Scilab 5.2, it is possible to write LaTeX or MathML expression.
- strings
n vector of strings,
strings(i)is the legend of the ith curveStarting from Scilab 5.2, it is possible to write LaTeX or MathML expression.
- pos
(optional) specify where to draw the legend; this parameter may be a string (or equivalent but obsolete an integer). It can also be a vector
[x,y]which gives the coordinates (in user units) of the upper left corner of the legend box.In the first case the possible valuesare:
1 or "in_upper_right": the legend is drawn in the upper right-hand corner (default). This is the default value.
2 or "in_upper_left":the legend is drawn in the upper left-hand corner.
3 or "in_lower_left": the legend is drawn in the lower left-hand corner.
4 or "in_lower_right": the legend is drawn in the lower right-hand corner.
5 or "by_coordinates": interactive placement with the mouse .
-1 or "out_upper_right": the legend is drawn at the right of the upper right-hand corner.
-2 or "out_upper_left": the legend is drawn at the left of the upper left-hand corner.
-3 or "out_lower_left": the legend is drawn at the left of the lower left-hand corner.
-4 or "out_lower_right": the legend is drawn at the right of the lower right-hand corner.
-5 or "upper_caption": the legend is drawn above the upper left-hand corner.
-6 or "lower_caption": the legend is drawn below the lower left-hand corner.
- boxed
a boolean (default value %t) which sets ot not the drawing of the box.
- hl
a handle, points to the Compound containing all the legend .
Description
Puts a legend on the current plot using the specified strings as labels. legend prepends labels by a recall of the corresponding line or patch. The recall type and properties are recovered from the given handles:
when called without handle argument (or with a handle on an axes entity) the function first build the vectors of handle on polylines entities which are the children of the given axes.
In the interactive placement mode (opt=5) move the legend box with the mouse and press the left button to release it.
Examples
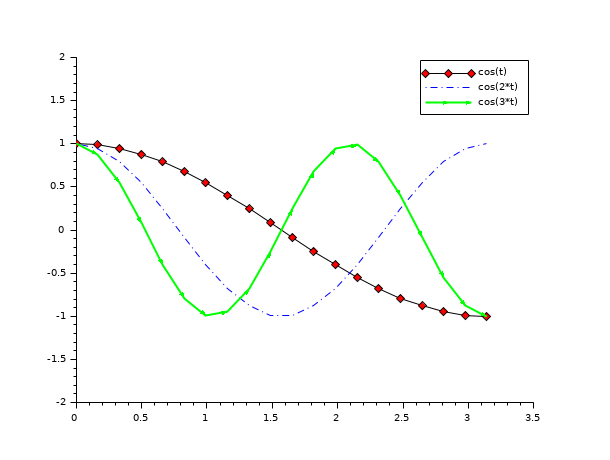
t=linspace(0,%pi,20);
a=gca();
a.data_bounds=[t(1) -1.8;t($) 1.8];

plot2d(t,[cos(t'),cos(2*t'),cos(3*t')],[-5,2 3]);
e=gce();
e1=e.children(1);
e1.thickness=2;
e1.polyline_style=4;
e1.arrow_size_factor = 1/2;
e.children(2).line_style=4;
e3=e.children(3);
e3.line_mode='on';
e3.mark_background=5;

hl=legend(['cos(t)';'cos(2*t)';'cos(3*t)']);
See also
- xstring — draw strings
- captions — draw graph captions
- polyline_properties — description of the Polyline entity properties
| Report an issue | ||
| << Label entity properties | annotation | Legend entity properties >> |