Please note that the recommended version of Scilab is 2026.1.0. This page might be outdated.
See the recommended documentation of this function
locate
mouse selection of a set of points in a 2D axes
Syntax
xy = locate()
xy = locate(n)
xy = locate(n, cross)
Arguments
- n
integer:
- n > 0 : number of points to be selected.
- any n ≤ 0 : undefined number of points. Stops the selection by right-clicking.
- cross
When
crossit set to 1, locate(.) displays a "X" mark at each clicked position in the current axes. Default = 0.- xy
matrix of size (2,n1). n1=n if the parameter n is given.
xy(1,:)are abscissae.xy(2,:)are ordinates.xy(:,i)are the [x;y] coordinates of the ith clicked point.
Description
locate is used to get the coordinates of one or more
points selected with the mouse in the current graphic axes. The coordinates values
use the data scales of the axes.
If n > 0, n points are expected to be selected. There is no way to
escape the series before the nth point is clicked (except
with CTRL+C).
The coordinates of selected points are returned in the matrix xy.
If n ≤ 0, points are selected until the user clicks the right
button of the mouse. The position of this exit click is neither recorded nor returned.
xy=locate() stands for xy=locate(-1).
Eventual crosses drawn when clicking are erased when locate() ends.
If the figure is closed (with its top-right cross) while locate() is running on it,
- if n>0 : [] is returned.
- if n <=0 : The coordinates of points already selected are returned.
 | Left clicking anywhere out of the current axes of the current figure does not select
any point. |
 | Logarithmic and/or reversed axes are supported. |
Examples
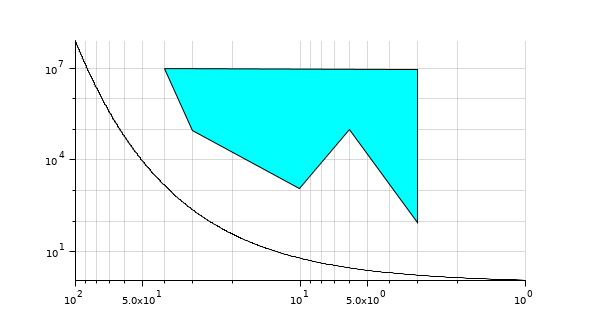
x = 1:0.1:100;
clf
plot2d("ll", x, 1.2 .^x)
xgrid(color("grey70")*[1 1], [1 1], [7 7]);
gca().axes_reverse(1) = "on";
gca().tight_limits = "on";
        gcf().axes_size=[600 320];
XY = locate(-1,1)  // Select any number of points. Right click to quit

// Draw a filled polygon made of the selected points
xfpolys(XY(1,:)',XY(2,:)', color("cyan"))
--> XY = locate(-1,1)
 XY  =
   40.22022    3.0199517   3.0199517   6.056507    10.102863   30.199517
   10082801.   9352311.2   94.100636   102608.45   1213.6949   95174.553
See also
- edit_curv — editor interativo de curvas gráficas
- interactive editor — Interactive plot editor
- rubberbox — Caixa tipo liga de borracha para seleção de um retângulo
- xclick — espera por um clique do mouse
- ged — Editor Gráfico do Scilab
| Report an issue | ||
| << event handler functions | interaction | rubberbox >> |