Please note that the recommended version of Scilab is 2026.0.1. This page might be outdated.
See the recommended documentation of this function
nyquistfrequencybounds
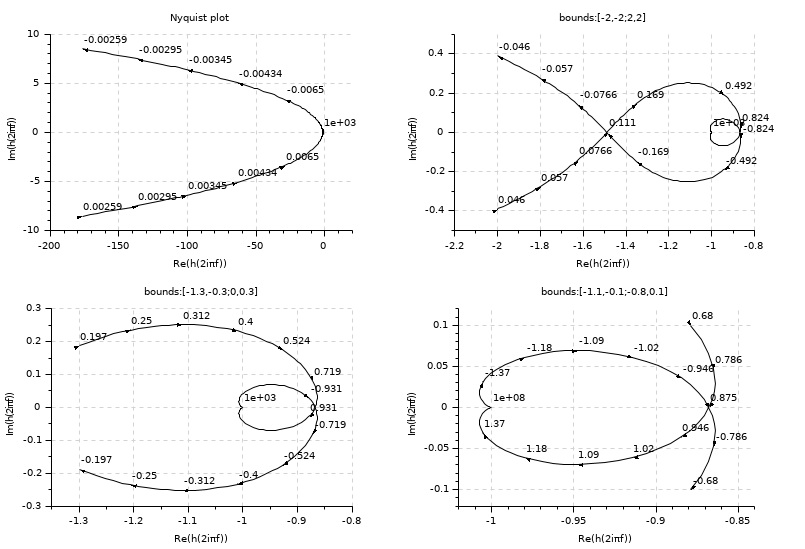
Computes the frequencies for which the nyquist locus enters and leaves a given rectangle.
Syntax
[fmin,fmax] = nyquistfrequencybounds(H,bounds)
Parameters
- H
A SISO or SIMO linear dynamical system, in state space, transfer function or zpk representations, in continuous or discrete time.
- bounds
A 2 by 2 array: [Rmin Imin;Rmax Imax] that defines a complex-plane rectangle.
- fmin
a real: the lowest frequency (Hz) such that the nyquist locus enters the given rectangle or 0 if the 0 Hz point lies in the rectangle or [] if the locus is completely outside the rectangle.
- fmax
a real: the highest frequency (Hz) such that the nyquist locus leaves the given rectangle or %inf if the %inf (hz) point is in the rectangle or [] if the locus is completely outside the rectangle.
Description
Given a C plane rectangle,
nyquistfrequencybounds Computes the lowest
frequency for which the nyquist locus enters the rectangle and
the highest frequency for which the nyquist locus leaves the
rectangle.
Examples
s=%s
num=2+9*s-9*s^2-11*s^3+0.01*s^4;
den=43*s^2+65*s^3+34*s^4+8*s^5+s^6+0.1*s^7
H=syslin('c',num,den)-1

clf;set(gcf(),'axes_size',[805,549])
subplot(221)
nyquist(H)

subplot(222)
bounds=[-2 -2;2 2]
[fmin,fmax]=nyquistfrequencybounds(H,bounds)
nyquist(H,fmin,fmax)
title("bounds:"+sci2exp(bounds,0));

subplot(223)
bounds=[-1.3 -0.3;0 0.3]
[fmin,fmax]=nyquistfrequencybounds(H,bounds)
nyquist(H,fmin,fmax)
title("bounds:"+sci2exp(bounds,0));

subplot(224)
bounds=[-1.1 -0.1;-0.8 0.1]
[fmin,fmax]=nyquistfrequencybounds(H,bounds)
nyquist(H,fmin,1d8)
title("bounds:"+sci2exp(bounds,0));

See also
- nyquist — nyquist plot
History
| Version | Description |
| 6.0 | handling zpk representation |
| Report an issue | ||
| << nyquist | Domaine de fréquence | phasemag >> |