Scilab 6.0.1
Please note that the recommended version of Scilab is 2026.1.0. This page might be outdated.
See the recommended documentation of this function
xgrid
2次元または3次元プロットにグリッドを追加
呼び出し手順
xgrid([color] [, thickness] [, style])
引数
- color
整数または行行列.
- thickness
実数または行行列.
- style
整数または行行列.
説明
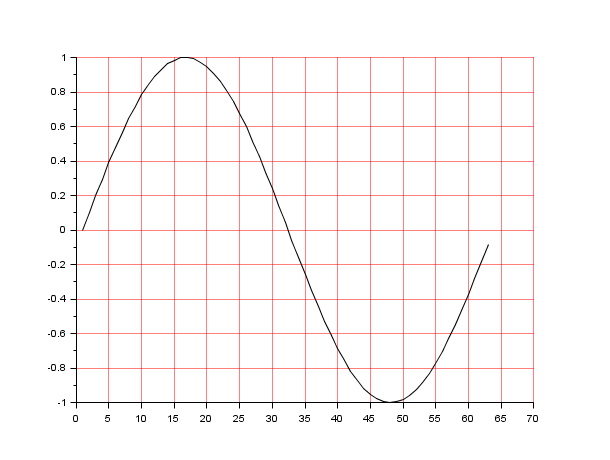
xgridは2次元または3次元プロットにグリッドを追加します.
color はグリッドのプロットで使用されるカラーIDです
(colorがスカラーの場合,同じ色が各軸で使用されます).
thickness はグリッドのプロットで使用される太さです
(thicknessがスカラーの場合,同じ太さが各軸で使用されます).
styleはグリッドのプロットで使用されるスタイルです
(styleがスカラーの場合,同じスタイルが各軸で使用されます).
利用可能なスタイルはline_styleプロパティと同じです
(axes_properties参照).
履歴
| Version | Description |
| 5.5.0 | 引数 thickness および style
が導入されました. |
| Report an issue | ||
| << unzoom | axes_operations | xsetech >> |