Please note that the recommended version of Scilab is 2026.1.0. This page might be outdated.
See the recommended documentation of this function
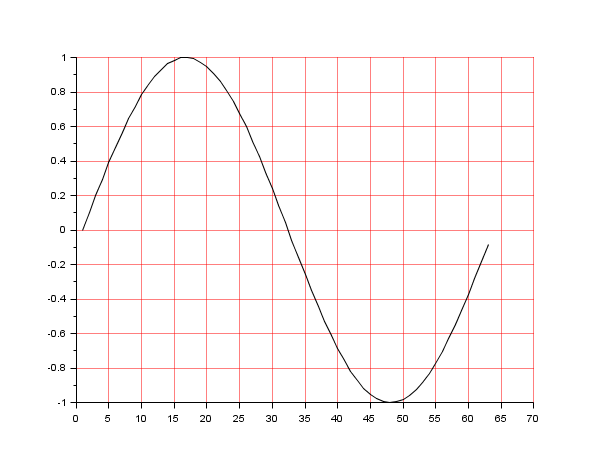
xgrid
add a grid on a 2D or 3D plot
Syntax
xgrid([color] [, thickness] [, style])
Arguments
- color
an integer or a row matrix.
- thickness
a real or a row matrix.
- style
an integer or a row matrix.
Description
xgrid adds a grid on a 2D or 3D plot.
d for each axis).
color is the colors id to use for the grid plotting (if color is a scalar then the same color is used for each axis).
thickness is the thickness to use for the grid plotting (if thickness is a scalar then the same thickness is used for each axis).
style is the style to use for the grid plotting (if style is a scalar then the same style is used for each axis). Available styles are the same as for line_style property (see axes_properties).
See also
- axes_properties — description of the axes entity properties
- plot2d — 2D plot
History
| Version | Description |
| 5.5.0 | Arguments thickness and style introduced. |
| Report an issue | ||
| << unzoom | axes_operations | xsetech >> |