- Scilabヘルプ
- Graphics
- 2d_plot
- 3d_plot
- annotation
- axes_operations
- axis
- bar_histogram
- Color management
- Datatips
- figure_operations
- geometric_shapes
- handle
- interaction
- lighting
- load_save
- polygon
- property
- text
- transform
- Compound_properties
- GlobalProperty
- Graphics: Getting started
- graphics_entities
- object_editor
- pie
- xchange
- xget
- xgetech
- xset
Please note that the recommended version of Scilab is 2026.0.1. This page might be outdated.
See the recommended documentation of this function
object_editor
グラフィックオブジェクトエディタの機能に関する説明
graphic
グラフィックオブジェクトエディタの機能に関する説明
menus
グラフィックオブジェクトエディタの機能に関する説明
説明
Scilab graphics allow the user to have interaction with graphics before and after having them drawn. Each graphics window and the drawing it contains are represented by hierarchical entities. The hierachy top level is the Figure. Each Figure defines at least one child of type Axes. Each Axes entity contains a set of leaf entities which are the basic graphics objects like Polylines, Rectangles, Arcs, Segs,... It can also contain a Compound type which are recursive sets of entities.
The main interest of the graphic mode is to make property changes easier. This graphics'mode provides a set of high-level graphing routines (see set, get) used to control objects' properties such as data, coordinates and scaling, color and appearences without requiring to replay the initial graphics commands.
Graphics entities are associated to Scilab variables of type
handle. The handle is a unique identifier which is associated
to each instance of a created graphical entity. Using this handle, it will
be possible to reach entities' properties through "set" and "get"
routines. The handles are also used to manipulate graphics objects, to
move them, to make copies or delete them.
To complete and use the graphics handle capacity at its maximum, a
graphic object editor has been created too. It is a set of Tcl/Tk
interfaces available for each kind of graphics objects (see
graphics_entities for more details) that can be enabled for
each graphic window. To make it work, select the Edit menu in
the graphic window. Seven graphics editing operations are available :
- Select figure as current:
Let this
figure be the current one.
- Redraw figure:
Redraw the content of the graphics window.
- Erase figure:
Erase the content of the graphics window. Its action corresponds to
clfroutine.- Copy object:
Using the mouse, it allows the user to select a 2D object (like a curve, a rectangle...) and put it in the clipboard. Thus, by a next call to
Paste object, the object is copied in the selected current axes.- Paste object:
Allow the user to paste a previous object put into in the clipboard inside the selected current axes.
- Move object:
Using the mouse, it allows the user to move a 2D object (like a curve, a rectangle...) inside the selected current axes.
- Delete object:
Using the mouse, it allows the user to pick up a 2D object (like a curve, a rectangle...) inside the selected current axes and to delete it instantly.
- Figure Properties:
Launch the Tcl/Tk interface for the Figure object applied to the figure handle of the graphics window.
- Current Axes Properties:
Launch the Tcl/Tk interface for the Axes object applied to the current axes handle of the graphics window.
- Start Entity Picker:
Start an event handler on the graphics window to catch the mouse clicks on graphics objects and launch the corresponding Tcl/Tk interface. The left mouse-click allows object edition and the right click performs a move of the selected object. Note that, for now, this feature is applied to 2D objects only.
- Stop Entity Picker:
Stop the action of the Entity Picker by terminating the event handler on the graphics window.
Once the graphic interface is enabled (using the Figure
Properties
or Current Axes Properties options), two
main areas appear :
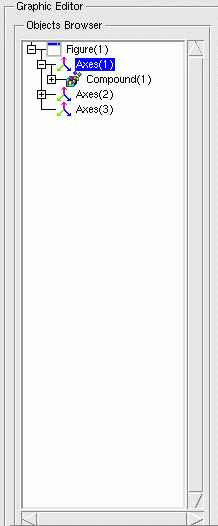
- A tree selector:
Placed on the left side of the graphical editor, a hierarchical tree selector specifies which object is currently edited. It can be used to switch from a graphic object to another provided that they are in the same graphic window.

- A notebook:
The second area represents a notebook composed with different properties pages (like
Style,Data,Clipping...) depending on the selected graphic object. Using this editor, man can edit more easily the whole properties set of each graphic object (like through the"set"and"get"commands). Here is an example of the axes' notebook displaying axes properties:

Furthermore, you can legend/annotate your figure using sample
primitives given inside the Insert menu in the graphic
window. Using the mouse and following the instruction in the message
subwindow, you can add a:
- Line:
Draw a line between 2 left mouse clicks. The line lives in the axes where the first point was selected.
- Polyline:
Draw a polyline by clicking on the left button to define the line path and right click at last to complete the drawing. The polyline lives in the axes where the first point was selected.
- Arrow:
Draw an arrow between 2 left mouse clicks. The arrow lives in the axes where the first point was selected.
- Double arrow:
Draw a double-sided arrow between 2 left mouse clicks. The double arrow lives in the axes where the first point was selected.
- Text:
Open a dialog box to enter the text, then click on the figure window to place it. The text lives in the axes where the point was selected.
- Rectangle:
Draw a rectangle : 2 left mouse clicks define respectively the upper left corner and the lower-right corner of the rectangle. The rectangle lives in the axes where the first point was selected.
- Circle:
Draw a circle : 2 left mouse clicks define respectively the upper left corner and the lower-right corner of the bounding-box where the circle lives. The rectangle lives in the axes where the first point was selected.
参照o
| Report an issue | ||
| << graphics_entities | Graphics | pie >> |