- Scilabヘルプ
- Graphics
- 2d_plot
- 3d_plot
- annotation
- axes_operations
- axis
- bar_histogram
- Color management
- Datatips
- figure_operations
- geometric_shapes
- handle
- interaction
- lighting
- load_save
- polygon
- property
- text
- transform
- Compound_properties
- GlobalProperty
- Graphics: Getting started
- graphics_entities
- object_editor
- pie
- xchange
- xget
- xgetech
- xset
Please note that the recommended version of Scilab is 2026.0.1. This page might be outdated.
However, this page did not exist in the previous stable version.
xgetech
カレントのグラフィックスケールを取得 (obsolete)
呼び出し手順
[wrect,frect,logflag,arect]=xgetech()
引数
- wrect,frect
実数ベクトル.
- logflag
大きさ 2の文字列 "xy".
説明
 | This function is obsolete. It will be removed from Scilab 6.1. Please use
ax=gca(); (ax.axes_bounds, ax.data_bounds(:)', ax.log_flags, ax.margins)
or any combination instead. |
xgetech は(カレントのウインドウの)カレントのグラフィックスケール
を返します.
frectにより指定される矩形[xmin,ymin,xmax,ymax]は
グラフィックウインドウ全体の大きさです.
プロットはwrectにより指定されるカレントのグラフィックウインドウの
領域に対して行われます.
wrect=[x,y,w,h] (左上の点, 幅, 高さ) はグラフィックウインドウ内の
領域を記述します.
wrectの値はグラフィックウインドウの幅と高さの比により指定されます:
wrect=[0 0 1 1] はグラフィックウインドウ全体が使用されることを意味します.
wrect=[0.5 0 0.5 1] はグラフィック領域が
グラフィックウインドウの右半分となることを意味します.
logflagは大きさ2の文字列 "xy" で,
x および y は "n" または "l" とすることができます.
"n"は通常(線形)スケール, "l" はログスケールを意味します.
x はx軸, y はy軸を意味します.
arect=[x_left, x_right,y_up,y_down] はサブウインドウ内の
フレームの大きさを指定します.
グラフィックフレームは( wrectのように)
カレントのグラフィックサブウインドウの幅または高さとの比により指定されます.
デフォルト値は1/8*[1,1,1,1]です.
arect が指定されない場合,カレントの値は変更されません.
例
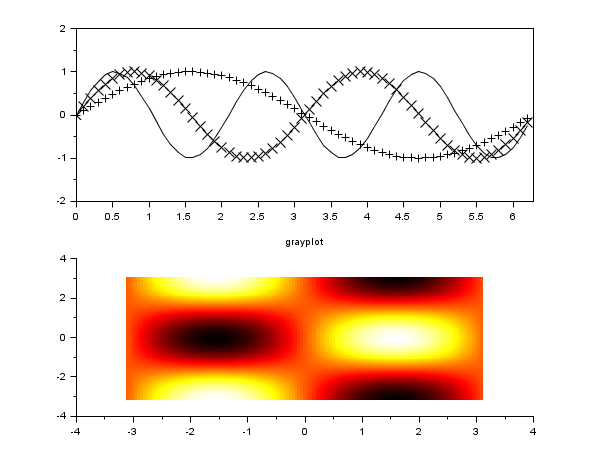
// 最初のサブウインドウ

xsetech([0,0,1.0,0.5])

plot2d()

// 続いてxsetechにより2番目のサブウインドウを設定

xsetech([0,0.5,1.0,0.5])

grayplot()

// 最初のサブウインドウのグラフィックスケールを取得

xsetech([0,0,1.0,0.5])

[wrect,frect,logflag,arect]=xgetech();

// 2番目のサブウインドウのグラフィックスケールを取得

xsetech([0,0.5,1.0,0.5])

[wrect,frect,logflag,arect]=xgetech();

clf('reset');

参照
- xsetech — プロット時にグラフィックウインドのサブウインドウを設定
履歴
| Version | Description |
| 6.0.1 | xgetech() is tagged obsolete for removal from Scilab 6.1. |
| Report an issue | ||
| << xget | Graphics | xset >> |