- Справка Scilab
- Графики
- 2d_plot
- champ
- champ1
- champ properties
- comet
- contour2d
- contour2di
- contour2dm
- contourf
- errbar
- fchamp
- fec
- fec properties
- fgrayplot
- fplot2d
- grayplot
- grayplot properties
- graypolarplot
- histplot
- ВидЛинии
- Matplot
- Matplot1
- Matplot properties
- paramfplot2d
- plot
- plot2d
- plot2d2
- plot2d3
- plot2d4
- polarplot
- scatter
- Sfgrayplot
- Sgrayplot
Please note that the recommended version of Scilab is 2026.1.0. This page might be outdated.
See the recommended documentation of this function
contour2dm
compute level curves of a surface defined with a mesh
Syntax
[xc, yc] = contour2dm(x, y, polygons, func, nz)
Arguments
- x, y
two vectors of size
n,(x(i),y(i))gives the coordinates of nodei.- polygons
is a
[Ntr,N+2]matrix. Each line ofpolygonsspecifies a convex polygon of the meshpolygons(j) = [number,node1,node2,node3, ..., nodeN, flag].node1,node2,node3, ..., nodeNare the number of the nodes which constitutes the polygon. number is the number of the polygons and flag is an integer not used in thecontour2dmfunction.- func
a vector of size
n:func(i)gives the value at nodeiof the function.- nz
the level values or the number of levels.
- If
nzis an integer its value gives the number of level curves equally spaced from
zmintozmaxas follows:z= zmin + (1:nz)*(zmax-zmin)/(nz+1)
- If
nzis a vector nz(i)gives the value of thei-th level curve.
- If
- xc, yc
vectors of identical sizes containing the contours definitions. See below for details.
Description
contour2dm computes level curves of a surface
z = f(x, y) on a 2D plot. The values of
f(x,y) are given by the matrix z
at the points of the mesh defined by x and y.
xc(1) contains the level associated with first
contour path, yc(1) contains the number
N1 of points defining this contour path and
(xc(1+(1:N1)), yc(1+(1:N1)) )
contain the coordinates of the paths points. The second path begin
at xc(2+N1) and yc(2+N1) and
so on.
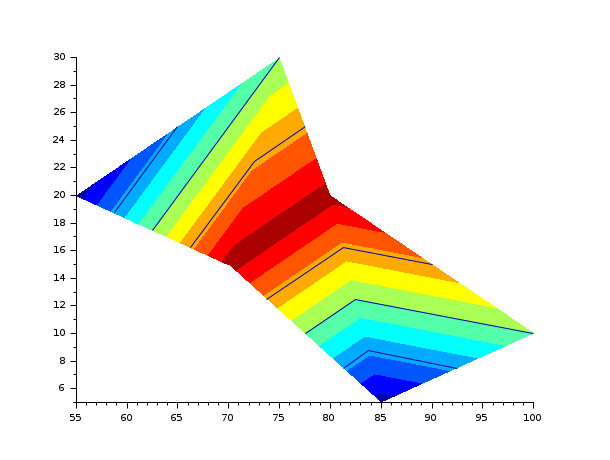
Note that some loops can appear on a level curve when some vertexes of polygons as the same value as the level one. See example #2
Examples
m = [6 5 4; ...
           6 2 5; ...
           6 4 1; ...
           5 2 3];

nodes = [55  20; ...
          85  5; ...
          100 10; ...
          75  30; ...
          80  20; ...
          70  15];
z_fec = [-1 -1 0 0 1 1];

f = scf();
f.color_map = jetcolormap(12);
fec(nodes(:, 1), nodes(:, 2), [(1:size(m, 1))', m, (1:size(m, 1))'], z_fec);
[xc, yc] = contour2dm(nodes(:,1), nodes(:,2), [(1:size(m, 1))', m, (1:size(m, 1))'], z_fec, [-0.5, 0, 0.5]);
k=1;n=yc(k);c=1;
N = size(xc, '*')
while k <= N & k+yc(k)<=N
  n=yc(k);
  plot2d(xc(k+(1:n)),yc(k+(1:n)));
  c=c+1;
  k=k+n+1;
end
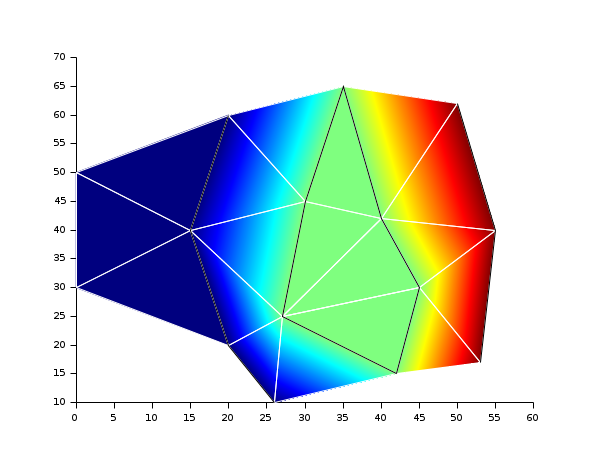
f=scf();
f.color_map = jetcolormap(3);
m = [1  2  3; ...
     1  3  4; ...
     3  4  5; ...
     6  2  3; ...
     7  6  3; ...
     7  3  5; ...
     7  5  8; ...
     2  9  6; ...
     9  6  10; ...
     6  7  10; ...
     10 11 7; ...
     7  8  12; ...
     9  10 13; ...
     7  10 11; ...
     7  12 11; ...
     13 10 14; ...
     10 11 14; ...
     11 14 15; ...
     11 12 15];

nodes = [0  50; ... //1
         20 60; ... //2
         15 40; ... //3
         0  30; ... //4
         20 20; ... //5
         30 45; ... //6
         27 25; ... //7
         26 10; ... //8
         35 65; ... //9
         40 42; ... //10
         45 30; ... //11
         42 15; ... //12
         50 62; ... //13
         55 40; ... //14
         53 17]; //15

z = [0, 0, 0, 0, 0, 1, 1, 0, 1, 1, 1, 1, 2, 2, 2];

nb_mesh = [(1:size(m, 1))', m, (1:size(m, 1))'];
fec(nodes(:, 1), nodes(:, 2), nb_mesh, z, mesh=%t);
e=gce();
e.children.foreground = -2;

// Contour2dm
[xc, yc] = contour2dm(nodes(:,1), nodes(:,2), nb_mesh, z, linspace(0,3,4));
k=1;n=yc(k);c=1;
N = size(xc, '*');
while k <= N & k+yc(k)<=N
    n=yc(k);
    plot2d(xc(k+(1:n)),yc(k+(1:n)));
    e=gce();
    e.children.foreground = -1;
    c=c+1;
    k=k+n+1;
end
// Here we have a loop in the green part because each vertex on this level curve is equal to 1.
// To be clearer, let us change the color_map
f.color_map = jetcolormap(1024);
See also
- contour2di — вычисляет кривые уровней поверхности на двумерном графике
- contour2d — кривые уровней поверхности на двумерном графике
- contour — level curves on a 3D surface
- fec — pseudo-color plot of a function defined on a mesh
- plot2d — 2D plot
History
| Версия | Описание |
| 5.5.2 | Function contour2dm introduced. |
| Report an issue | ||
| << contour2di | 2d_plot | contourf >> |