- Справка Scilab
- Графики
- 2d_plot
- champ
- champ1
- champ properties
- comet
- contour2d
- contour2di
- contour2dm
- contourf
- errbar
- fchamp
- fec
- fec properties
- fgrayplot
- fplot2d
- grayplot
- grayplot properties
- graypolarplot
- histplot
- ВидЛинии
- Matplot
- Matplot1
- Matplot properties
- paramfplot2d
- plot
- plot2d
- plot2d2
- plot2d3
- plot2d4
- polarplot
- scatter
- Sfgrayplot
- Sgrayplot
Please note that the recommended version of Scilab is 2026.1.0. This page might be outdated.
See the recommended documentation of this function
Matplot
2D plot of a matrix using colors
Syntax
Matplot(a, [strf, rect, nax])
Matplot(a, <opt_args>)
Arguments
- a
a real matrix of size (
n1,n2).- <opt_args>
this represents a sequence of statements
key1=value1, key2=value2, ...wherekey1,key2, ... can be one of the following:- rect
sets the bounds of the plot. If this key is given and neither
frameflagnorstrfis given then theycharacter ofstrfis supposed to be7. See below for value.- nax
sets the grids definition. If this key is given and neither
axesflagnorstrfis given then thezcharacter ofstrfis supposed to be1. See below for value.- frameflag
specifies how the frame of the plot is computed. The value is an integer ranging from
0to8. It corresponds to theycharacter ofstrf. See below.- axesflag
specifies what kind of axes are drawn around the plot. The value is an integer ranging from
0to5. It corresponds to thezcharacter ofstrf. See below.
- strf
is a string of length 3
"xyz".- default
the default is
"081".- x
controls the display of captions.
- x=0
no caption.
- x=1
captions are displayed. They are given by the optional argument
leg.
- y
controls the computation of the actual coordinate ranges from the minimal requested values. Actual ranges can be larger than minimal requirements.
- y=0
no computation, the plot use the previous (or default) scale.
- y=1
from the
rectargument.- y=2
from the min/max of the x, y data.
- y=3
built for an isometric scale from the
rectargument.- y=4
built for an isometric plot from the min/max of the x, y data.
- y=5
enlarged for pretty axes from the
rectargument.- y=6
enlarged for pretty axes from the min/max of the x, y data.
- y=7
like
y=1but the previous plots are redrawn to use the new scale.- y=8
like
y=2but the previous plots are redrawn to use the new scale.
- z
controls the display of information on the frame around the plot. If axes are requested, the number of ticks can be specified by the
naxoptional argument.- z=0
nothing is drawn around the plot.
- z=1
axes are drawn, the y-axis is displayed on the left.
- z=2
the plot is surrounded by a box without ticks.
- z=3
axes are drawn, the y-axis is displayed on the right.
- z=4
axes are drawn centred in the middle of the frame box, with the box disabled.
- z=5
axes are drawn centred in the middle of the frame box, with the box enabled.
- rect
This argument is used when the second character
yof argumentstrfis1,3or5. It is a row vector of size 4 and gives the dimension of the frame:rect = [xmin, ymin, xmax, ymax].- nax
This argument is used when the third character
zof argumentstrfis1. It is a row vector with four entries[nx, Nx, ny, Ny]wherenx(ny) is the number of subgraduations on the x (y) axis andNx(Ny) is the number of graduations on the x (y) axis.
Description
The entries of matrix int(a) are used as colormap entries
in the current colormap. The color associated to a(i,j)
is used to draw a small square of size 1 with center at location
(x=j, y=(n1-i+1)).
If a matrix entry is outside the colormap, the corresponding rectangle is not displayed.
 | To update the Matplot data, the data field of the corresponding handle must be used. |
data can be a matrix (or an hypermatrix) containing RGB, RGBA, ... data (see Matplot_properties).
Enter the command Matplot() to see a demo.
Examples
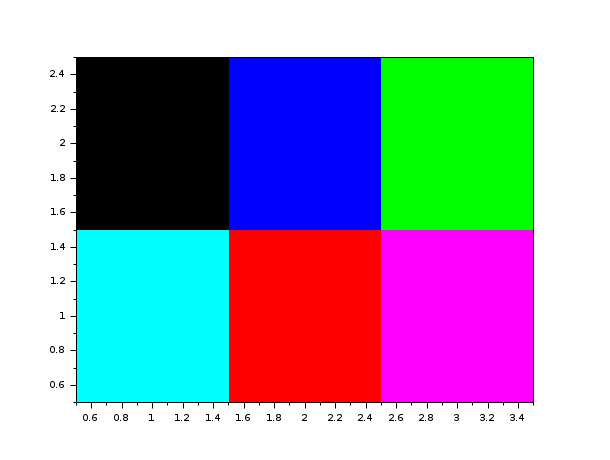
Matplot([1 2 3;4 5 6])
See also
- colormap — using colormaps
- plot2d — 2D plot
- Matplot1 — 2D plot of a matrix using colors
- Matplot_properties — Description of the Matplot entities properties
History
| Версия | Описание |
| 5.5.0 | data can now be a matrix (or an hypermatrix) containing RGB, RGBA, ... data (see Matplot_properties). |
| Report an issue | ||
| << ВидЛинии | 2d_plot | Matplot1 >> |