Scilab 6.0.0
- Aide de Scilab
- Traitement du Signal
- Filtres
- analpf
- buttmag
- casc
- cheb1mag
- cheb2mag
- convol
- ell1mag
- eqfir
- eqiir
- faurre
- ffilt
- filt_sinc
- filter
- find_freq
- frmag
- fsfirlin
- group
- hilbert
- iir
- iirgroup
- iirlp
- kalm
- lev
- levin
- lindquist
- remez
- remezb
- srfaur
- srkf
- sskf
- syredi
- system
- trans
- wfir
- wfir_gui
- wiener
- wigner
- window
- yulewalk
- zpbutt
- zpch1
- zpch2
- zpell
Please note that the recommended version of Scilab is 2026.0.1. This page might be outdated.
See the recommended documentation of this function
wigner
'time-frequency' wigner spectrum
Syntax
[tab]=wigner(x,h,deltat,zp)
Arguments
- tab
wigner spectrum (lines correspond to the time variable)
- x
analyzed signal
- h
data window
- deltat
analysis time increment (in samples)
- zp
length of FFT's.
%pi/zpgives the frequency increment.
Description
function which computes the 'time-frequency' wigner spectrum of a signal.
Sample

Examples
a=[488^2 488 1;408^2 408 1;568^2 568 1];
b=[1.28;0;0];
x=a\b;
t=408:568;
p=x'*[t.*t;t;ones(t)];
// unit step function
u=[0*ones(408:487) ones(488:568)];
// finite duration sinusoid
s=p.*sin(2*%pi/16*t+u*%pi);
// signal to be analyzed
s=[0*ones(0:407) s 0*ones(569:951)];
// 64-point rectangular window
h=ones(1,64);
// wigner spectrum
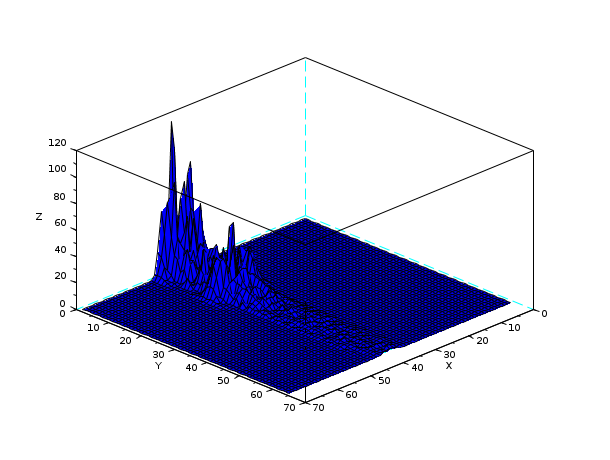
w=wigner(s,h,12,128);
scf();
plot3d(1:69,1:64,abs(w(1:69,1:64)));
| Report an issue | ||
| << wiener | Filtres | window >> |