Scilab 6.0.0
Please note that the recommended version of Scilab is 2026.1.0. This page might be outdated.
See the recommended documentation of this function
fftshift
rearranges the fft output, moving the zero frequency to the center of the spectrum
Syntax
y=fftshift(x [,job])
Arguments
- x
real or complex vector or matrix.
- y
real or complex vector or matrix.
- job
integer, dimension selection, or string 'all'
Description
If x results of an fft computation y=fftshift(x) or y=fftshift(x,"all") moves the zero frequency component to the center
of the spectrum, which is sometimes a more convenient form.
If x is a vector of size n, y is the vector x([n/2+1:n,1:n/2])
If x is an m by n matrix y is the matrix
x([m/2+1:n,1:m/2],[n/2+1:n,1:n/2]).
[x11 x12]                  [x22 x21]
x=[       ]        gives   y=[       ]
[x21 x22]                  [x12 x11]
y=fftshift(x,n) makes the swap only along the nth dimension
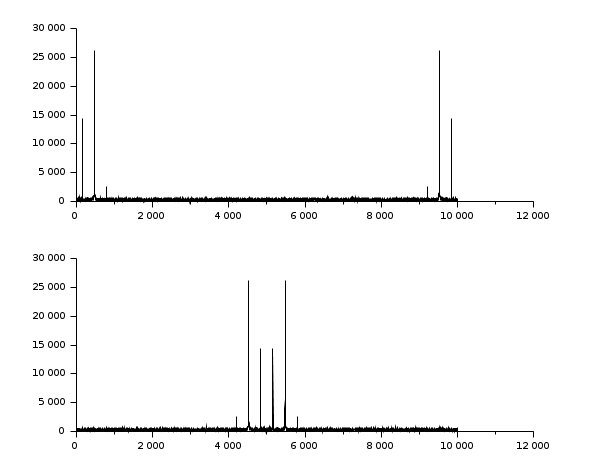
Examples
// Make a signal
t=0:0.1:1000;
x=3*sin(t)+8*sin(3*t)+0.5*sin(5*t)+3*rand(t);
// Compute the fft
y=fft(x,-1);

// Display
clf();
subplot(2,1,1);plot2d(abs(y))
subplot(2,1,2);plot2d(fftshift(abs(y)))
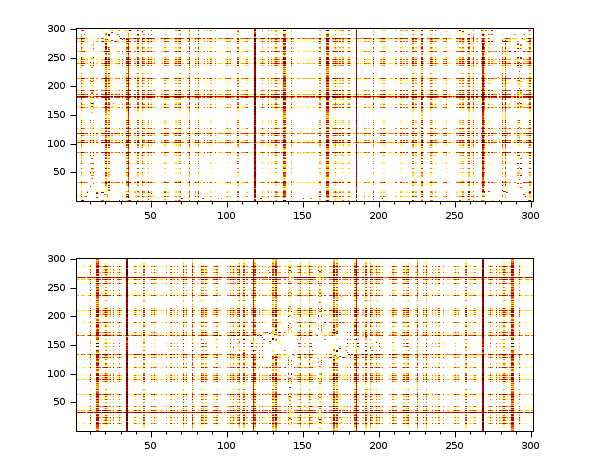
// Make a 2D image
t=0:0.1:30;
x=3*sin(t')*cos(2*t)+8*sin(3*t')*sin(5*t)+..
  0.5*sin(5*t')*sin(5*t)+3*rand(t')*rand(t);
// Compute the fft
y=fft(x,-1);

// Display
clf();
gcf().color_map = hotcolormap(256);
subplot(2,1,1);
Matplot(abs(y))
subplot(2,1,2);
Matplot(fftshift(abs(y)))
| Report an issue | ||
| << fft2 | Transforms | hilb >> |