Please note that the recommended version of Scilab is 2026.1.0. This page might be outdated.
See the recommended documentation of this function
hallchart
ホール図を描画
呼び出し手順
hallchart([ modules [,args [,colors]]])
パラメータ
- modules
実数ベクトル (モジュール (単位: dB))
- args
実数ベクトル (位相 (単位:度))
- colors
スカラーまたはベクトル, 等ゲインおよび等位相曲線の色インデックス
説明
ホール図をプロット: real(y), imag(y) 平面における
y/(1+y) の等モジュールおよび等引数等高線
hallchart は
nyquistと組み合わせて使用することができます.
modulesおよびargsのデフォルト値は
それぞれ次のようになります :
[-20 -10 -6 -4 -2 2 4 6 10 20]
[-90 -60 -45 -30 -15 15 30 45 60 90]
この関数はm_circle 関数の後継です
グラフィックエンティティの構成
hallchart関数は通常カレントの軸の最後の子である
Compoundオブジェクトを1つ作成します.
このCompoundオブジェクトには各グリッド曲線に一つずつの
compoundオブジェクトの集合が含まれます.
最初のオブジェクトは,等モジュール曲線,最後のオブジェクトは
等引数等高線となります.
これらのcompoundオブジェクトの各々には,
ポリラインオブジェクト(曲線)とテキストオブジェクト(ラベル)が含まれます.
以下のコードをi番目の等モジュール曲線の色を変更する際に使用することができます:
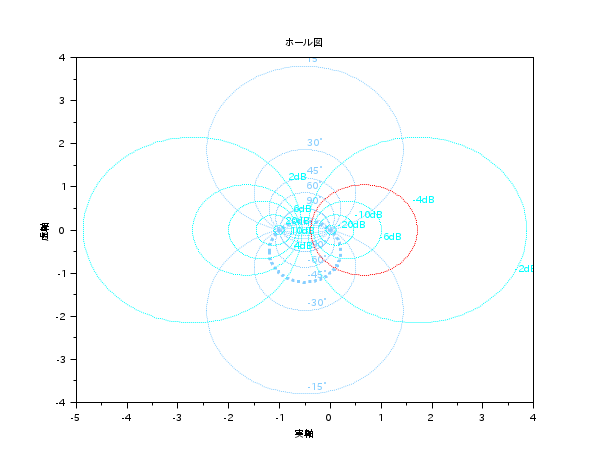
clf();hallchart()
ax=gca();//カレントの軸のハンドル
c=ax.children($).children;// chartグリッド曲線のハンドル
i=4; //-4dB曲線のインデックス
ci=c(i); //-4dB曲線のハンドル
ci.children(1).foreground=color('red'); //赤で描く
j=3; // the index of the -45°曲線のインデックス
cj=c(10+j); // -45° 曲線のハンドル
cj.children(1).thickness=3;//線幅を太くする
例
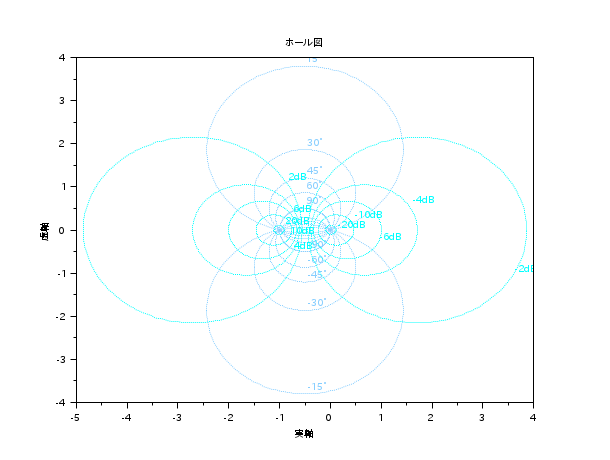
//ホール図
clf();hallchart()
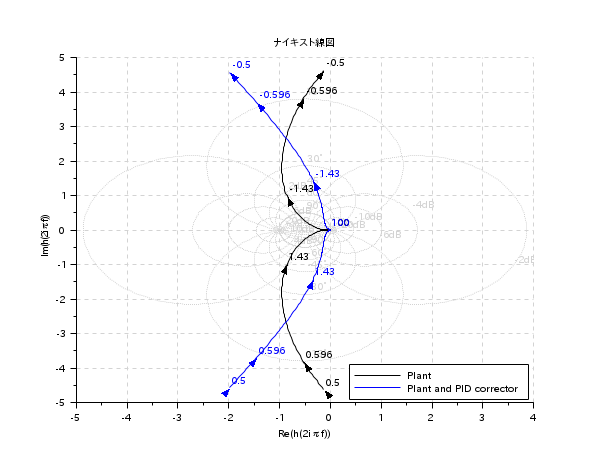
//ナイキストのグリッドとしてホール図を作成
s=poly(0,'s');
Plant=syslin('c',16000/((s+1)*(s+10)*(s+100)));
//二自由度PID
tau=0.2;xsi=1.2;
PID=syslin('c',(1/(2*xsi*tau*s))*(1+2*xsi*tau*s+tau^2*s^2));
clf();
nyquist([Plant;Plant*PID],0.5,100,["Plant";"Plant and PID corrector"]);
hallchart(colors=color('light gray')*[1 1])
//右下隅のキャプションを移動
ax=gca();Leg=ax.children(1);
Leg.legend_location="in_lower_right";
参照
- nyquist — ナイキスト線図
- nicholschart — ニコルス線図
| Report an issue | ||
| << gainplot | Plot and display | m_circle >> |