Scilab 5.5.1
Please note that the recommended version of Scilab is 2026.1.0. This page might be outdated.
See the recommended documentation of this function
subplot
divise une fenêtre graphique en sous-fenêtres
Séquence d'appel
subplot(m,n,p)
subplot(mnp)
Paramètres
- m,n,p
entiers positifs
- mnp
un entier avec
mnpcomme notation décimale
Description
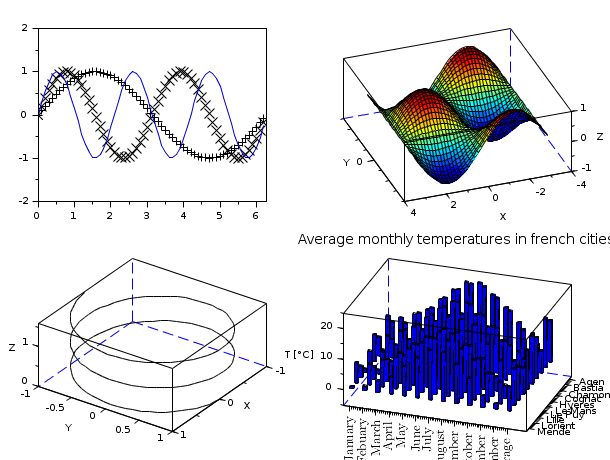
subplot(m,n,p) ou subplot(mnp) divise la fenêtre graphique courante en une matrice m x n matrice de sous fenêtres et sélectionne la p-ième sous-fenêtre comme emplacement de dessin par défaut. Le numéro de la sous-fenêtre est compté ligne par ligne, c'est à dire que l'emplacement (i,j) de la matrice porte le numéro (i-1)*n + j.
Exemples
Voir aussi
| Report an issue | ||
| << square | axes_operations | axes properties >> |