Please note that the recommended version of Scilab is 2026.1.0. This page might be outdated.
See the recommended documentation of this function
plot3d1
3D gray or color level plot of a surface
Calling Sequence
plot3d1(x,y,z,[theta,alpha,leg,flag,ebox])
plot3d1(xf,yf,zf,[theta,alpha,leg,flag,ebox])
plot3d1(x,y,z,<opts_args>)
plot3d1(xf,yf,zf,<opts_args>)
Arguments
- x,y
row vectors of sizes n1 and n2 (x-axis and y-axis coordinates). These coordinates must be monotone.
- z
matrix of size (n1,n2).
z(i,j)is the value of the surface at the point (x(i),y(j)).- xf,yf,zf
matrices of size (nf,n). They define the facets used to draw the surface. There are
nfacets. Each facetiis defined by a polygon withnfpoints. The x-axis, y-axis and z-axis coordinates of the points of the ith facet are given respectively byxf(:,i),yf(:,i)andzf(:,i).- <opt_args>
This represents a sequence of statements
key1=value1, key2=value2,... wherekey1,key2,...can be one of the following: theta, alpha ,leg,flag,ebox (see definition below).- theta, alpha
real values giving in degree the spherical coordinates of the observation point.
- leg
string defining the labels for each axis with @ as a field separator, for example "X@Y@Z".
- flag
a real vector of size three.
flag=[mode,type,box].- mode
an integer (surface color).
- mode>0
the surface is painted with color
"mode"; the boundary of the facet is drawn with current line style and color.- mode=0:
a mesh of the surface is drawn.
- mode<0:
the surface is painted with color
"-mode"; the boundary of the facet is not drawn.Note that the surface color treatement can be done using
color_modeandcolor_flagoptions through the surface entity properties (see surface_properties).
- type
an integer (scaling).
- type=0:
the plot is made using the current 3D scaling (set by a previous call to
param3d,plot3d,contourorplot3d1).- type=1:
rescales automatically 3d boxes with extreme aspect ratios, the boundaries are specified by the value of the optional argument
ebox.- type=2:
rescales automatically 3d boxes with extreme aspect ratios, the boundaries are computed using the given data.
- type=3:
3d isometric with box bounds given by optional
ebox, similarily totype=1.- type=4:
3d isometric bounds derived from the data, to similarily
type=2.- type=5:
3d expanded isometric bounds with box bounds given by optional
ebox, similarily totype=1.- type=6:
3d expanded isometric bounds derived from the data, similarily to
type=2.Note that axes boundaries can be customized through the axes entity properties (see axes_properties).
- box
an integer (frame around the plot).
- box=0:
nothing is drawn around the plot.
- box=1:
unimplemented (like box=0).
- box=2:
only the axes behind the surface are drawn.
- box=3:
a box surrounding the surface is drawn and captions are added.
- box=4:
a box surrounding the surface is drawn, captions and axes are added.
Note that axes aspect can also be customized through the axes entity properties (see axes_properties).
- ebox
It specifies the boundaries of the plot as the vector
[xmin,xmax,ymin,ymax,zmin,zmax]. This argument is used together withtypeinflag: if it is set to1,3or5(see above to see the corresponding behaviour). Ifflagis missing,eboxis not taken into acoount.Note that, when specified, the
eboxargument acts on thedata_boundsfield that can also be reset through the axes entity properties (see axes_properties).
Description
plot3d1 plots a surface with colors depending on the
z-level of the surface. This special plot function can also be enabled
setting color_flag=1 after a plot3d (see
surface_properties)
Enter the command plot3d1() to see a demo.
Examples
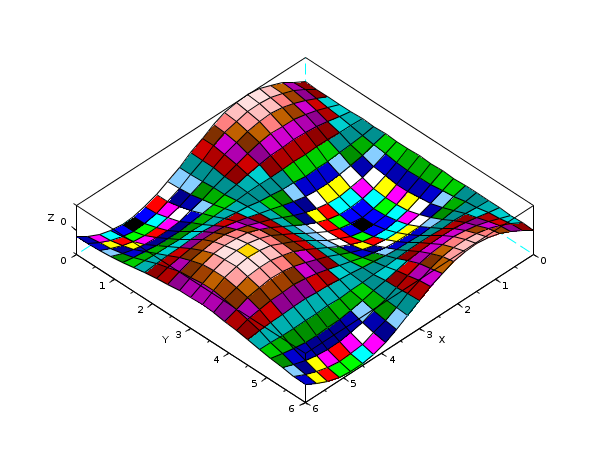
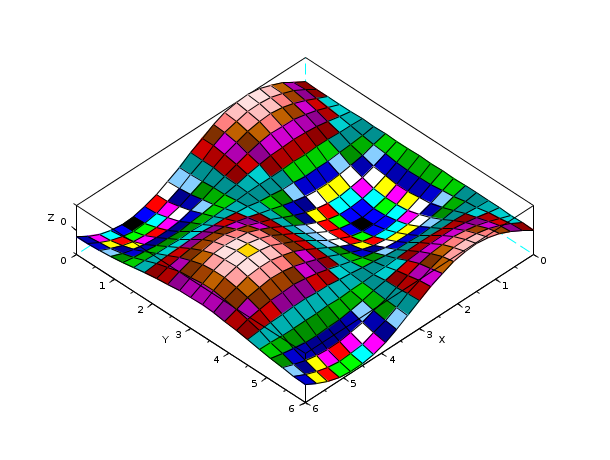
// same plot using facets computed by genfac3d
t=[0:0.3:2*%pi]';
z=sin(t)*cos(t');
[xx,yy,zz]=genfac3d(t,t,z);
plot3d1(xx,yy,zz)
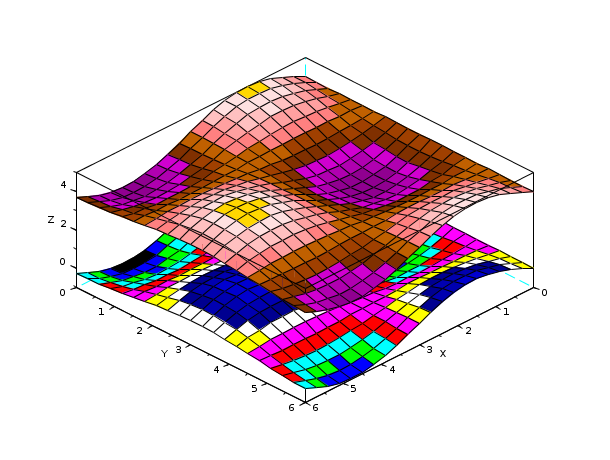
// multiple plots
t=[0:0.3:2*%pi]';
z=sin(t)*cos(t');
[xx,yy,zz]=genfac3d(t,t,z);
plot3d1([xx xx],[yy yy],[zz 4+zz])
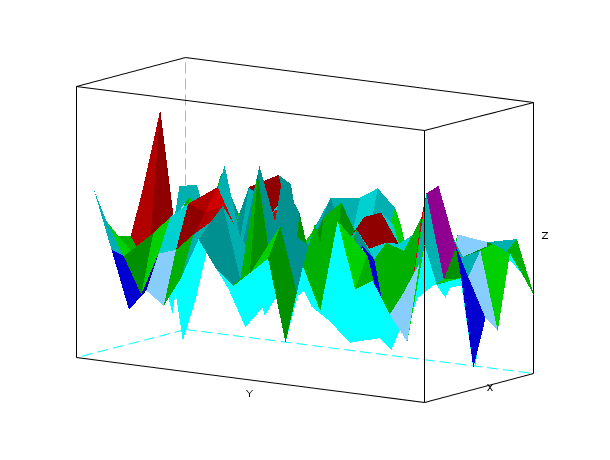
// simple plot with viewpoint and captions
plot3d1(1:10,1:20,10*rand(10,20),35,45,"X@Y@Z",[2,2,3])
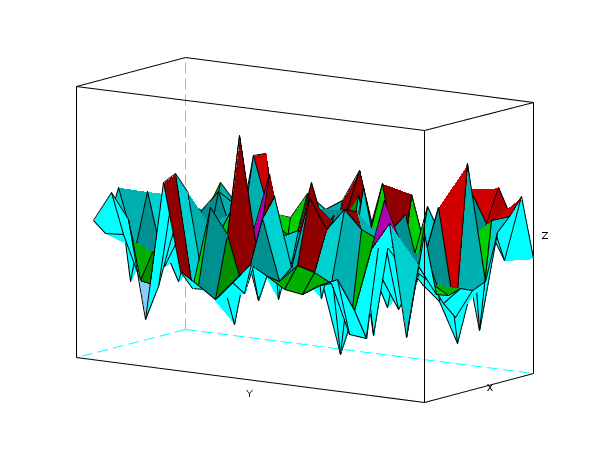
// same plot without grid
plot3d1(1:10,1:20,10*rand(10,20),35,45,"X@Y@Z",[-2,2,3])
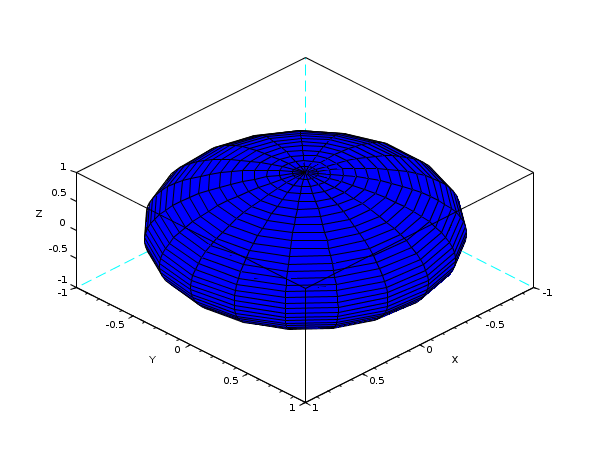
// plot of a sphere using facets computed by eval3dp
deff("[x,y,z]=sph(alp,tet)",["x=r*cos(alp).*cos(tet)+orig(1)*ones(tet)";..
"y=r*cos(alp).*sin(tet)+orig(2)*ones(tet)";..
"z=r*sin(alp)+orig(3)*ones(tet)"]);
r=1; orig=[0 0 0];
[xx,yy,zz]=eval3dp(sph,linspace(-%pi/2,%pi/2,40),linspace(0,%pi*2,20));
plot3d(xx,yy,zz)
e=gce();
e.color_flag=1;
scf(2);
plot3d1(xx,yy,zz) // the 2 graphics are similar
See Also
| Report an issue | ||
| << plot3d | 3d_plot | plot3d2 >> |