Scilab 5.3.3
Please note that the recommended version of Scilab is 2026.1.0. This page might be outdated.
See the recommended documentation of this function
datatipSetDisplay
Search the nearest datatip of a given point.
Calling Sequence
datatipSetDisplay(tip_handle,orient)
Arguments
- tip_handle
A handle on a datatip.
- orient
A character string with possible values:
"automatic""upper left""upper right","lower left","lower right".
Description
Set the position on the text box with respect to the curve
point. With the "automatic" orientation the
program makes the choice to keep the text box within the plot
boundaries.
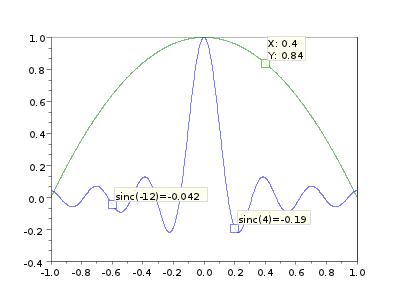
Examples
x=linspace(-1,1,1000);
clf()
plot(x,sinc(20*x),x,1-x^2);
e=gce();e=e.children;
d21=datatipCreate(e(2),600);
d22=datatipCreate(e(2),200);
d1=datatipCreate(e(1),700);

function str=mydisplay(curve, pt, index)
   str=msprintf('sinc(%-0.2g)=%-0.2g', 20*pt(1),pt(2))
endfunction
datatipSetDisplay(e(2),mydisplay)
See Also
- datatips — Tool for placing and editing tips along the plotted curves.
- datatipSetOrientation — Search the nearest datatip of a given point.
Authors
- Serge Steer, INRIA
| << datatipRemoveAll | Datatips | datatipSetInterp >> |