Please note that the recommended version of Scilab is 2026.1.0. This page might be outdated.
See the recommended documentation of this function
param3d_properties
description of the 3D curves entities properties
Description
The Param3d entity is a leaf of the graphics entities hierarchy.
- visible:
This field contains the
visibleproperty value for the entity . It should be"on"or"off". By default, the curves are visibles, the value's property is"on". If"off"the curves are not drawn on the screen.- data:
This field contains the coordinates of the 3d curves. it is the matrix
[X,Y,Z]such asX(:,i),Y(:,i),Z(:,i)contain the 3D coordinates of thei'th curve. This field contains the defaultline_styleproperty value for Segs, Arcs, Rectangle and Polyline objects.- line_mode:
This field contains the default
line_modeproperty value for the polyline. Its value should be"on"(line drawn) or"off"(no line drawn).- line_style:
This field selects the type of line to be used to draw lines . Its value should be an integer in [0 6]. 0 stands for solid, the other values stand for a selection of dashes (see getlinestyle).
- polyline_style:
This field selects the way curve are drawn: interpolated (default), staircase, barplot, arrowed and filled modes are available through integer index [1:5].
- mark_mode:
This field contains the default
mark_modeproperty value. Its value should be"on"or"off"(default value).- mark_style:
This field contains the default
mark_styleproperty value. Themark_styleselects the type of mark to be displayed. Its value should be an integer in [0 9] which stands for: dot, plus, cross, star, filled diamond, diamond, triangle up, triangle down, trefle and circle. The figure below shows the aspects of the marks depending on themark_styleand themark_foregroundandmark_backgroundproperties.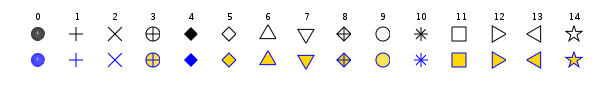
- mark_size_unit:
This field contains the default
mark_size_unitproperty value. Ifmark_size_unitis set to"point", then themark_sizevalue is directly given in points. Whenmark_size_unitis set to"tabulated",mark_sizeis computed relative to the font size array: therefore, its value should be an integer in [0 5] whith stands for 8pt, 10pt, 12pt, 14pt, 18pt and 24pt. Note that param3d and pure scilab functions usetabulatedmode as default ; when using plot function, thepointmode is automatically enabled.- mark_size:
This field contains the default
mark_sizeproperty value. The
mark_sizeselects the font size of the mark to be displayed. Its value should be an integer in [0 5] whith stands for 8pt, 10pt, 12pt, 14pt, 18pt and 24pt (see getmark).- mark_foreground:
This field contains the
mark_foregroundproperty value which is the marks' edge color. Its value should be a color index (relative to the current color_map).- mark_background:
This field contains the
mark_backgroundproperty value which is the marks' face color. Its value should be a color index (relative to the current color_map).- thickness:
This field contains the default
thicknessvalue of the lines used to draw the axes and the curves. It should be a positive integer.- foreground:
This field contains the color index used to draw the curves. Its value should be a color index (relative to the current colormap).
- clip_state:
This field contains the default
clip_stateproperty value. Its value should be :"off"this means that all curves created after that are not clipped (default value)."clipgrf"this means that all curves created after that are clipped outside the Axes boundaries."on"this means that all curves created after that are clipped outside the rectangle given by property clip_box.
- clip_box:
This field contains the default
clip_boxproperty value. Its value should be an empty matrix if clip_state is"off". Other case the clipping is given by the vector[x,y,w,h](upper-left point width height).- user_data:
This field can be use to store any scilab variable in the param3d data structure, and to retreive it.
- parent:
This property contains the handle of the parent. The parent of the 3D curves entity should be of type
"Axes"or"Compound".
Examples
a=get("current_axes");//get the handle of the newly created axes
t=[0:0.1:5*%pi]';
param3d1([sin(t),sin(2*t)],[cos(t),cos(2*t)],[t/10,sin(t)])

a.rotation_angles=[65,75];
a.data_bounds=[-1,-1,-1;1,1,2]; //boundaries given by data_bounds
a.thickness = 2;
h=a.children //get the handle of the param3d entity: an Compound composed of 2 curves
h.children(1).foreground = 3 // first curve
curve2 = h.children(2);
curve2.foreground = 6;
curve2.mark_style = 2;
Authors
Djalel ABDEMOUCHE
| << param3d1 | 3d_plot | plot3d >> |