- Manuel Scilab
- CACSD
- chart
- abcd
- abinv
- arhnk
- arl2
- arma
- arma2p
- armac
- armax
- armax1
- arsimul
- augment
- balreal
- bilin
- black
- bode
- bstap
- cainv
- calfrq
- canon
- ccontrg
- cls2dls
- colinout
- colregul
- cont_frm
- cont_mat
- contr
- contrss
- copfac
- csim
- ctr_gram
- dbphi
- dcf
- ddp
- des2ss
- des2tf
- dhinf
- dhnorm
- dscr
- dsimul
- dt_ility
- dtsi
- equil
- equil1
- evans
- feedback
- findABCD
- findAC
- findBD
- findBDK
- findR
- findx0BD
- flts
- fourplan
- frep2tf
- freq
- freson
- fspecg
- fstabst
- g_margin
- gainplot
- gamitg
- gcare
- gfare
- gfrancis
- gtild
- h2norm
- h_cl
- h_inf
- h_inf_st
- h_norm
- hallchart
- hankelsv
- hinf
- imrep2ss
- inistate
- invsyslin
- kpure
- krac2
- lcf
- leqr
- lft
- lin
- linf
- linfn
- linmeq
- lqe
- lqg
- lqg2stan
- lqg_ltr
- lqr
- ltitr
- m_circle
- macglov
- markp2ss
- minreal
- minss
- mucomp
- narsimul
- nehari
- nicholschart
- noisegen
- nyquist
- obs_gram
- obscont
- observer
- obsv_mat
- obsvss
- p_margin
- parrot
- pfss
- phasemag
- ppol
- prbs_a
- projsl
- reglin
- repfreq
- ric_desc
- ricc
- riccati
- routh_t
- rowinout
- rowregul
- rtitr
- sensi
- sgrid
- show_margins
- sident
- sm2des
- sm2ss
- sorder
- specfact
- ss2des
- ss2ss
- ss2tf
- st_ility
- stabil
- svplot
- sysfact
- syssize
- tf2des
- tf2ss
- time_id
- trzeros
- ui_observer
- unobs
- zeropen
- zgrid
Please note that the recommended version of Scilab is 2026.1.0. This page might be outdated.
See the recommended documentation of this function
hallchart
Draws the Hall chart
Calling Sequence
hallchart([ modules [,args [,colors]]])
Arguments
- modules
real vector ( modules (in dB))
- args
real vector (phases (in degree))
- colors
a scalar or a vector, the color indices for isogain and iso phase curves
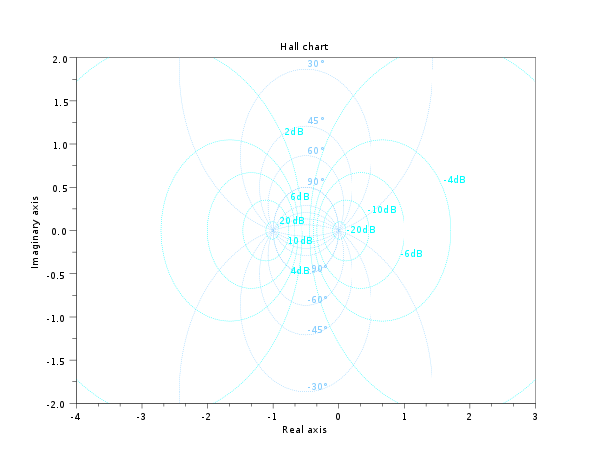
Description
plot the Hall'chart: iso-module and iso-argument contours of
y/(1+y) in the real(y), imag(y) plane
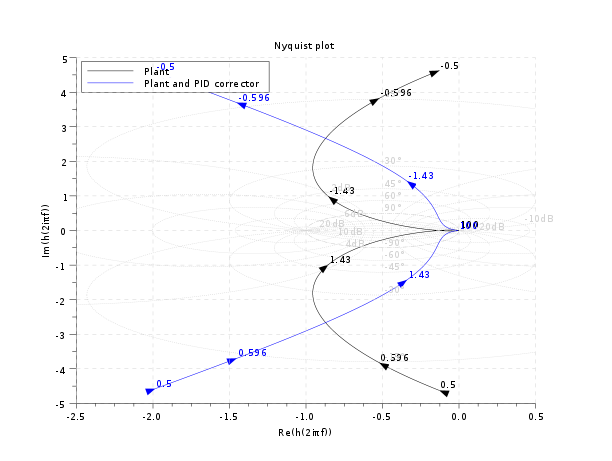
hallchart may be used in cunjunction with
nyquist.
The default values for modules and
args are respectively :
[-20 -10 -6 -4 -2 2 4 6 10 20]
[-90 -60 -45 -30 -15 15 30 45 60 90]
This function superseeds the m_circle function
Graphics entities organization
The hallchart function create a single
compound object which is generaly the last child of the current
axes. This compound object contains a set of compound objects, one
for each grid curve. The first ones are the iso module curves and
the last one the iso-argument contours. Each of these compound
objects contains a Polyline object (the curve) and a Text object
(the label). The following piece of code can be used to change the color of the ith iso module curve:
clf();hallchart()
ax=gca();//handle on current axes
c=ax.children($).children;// the handles on the chart grid curves
i=4; //the index of the -4dB curve
ci=c(i); //the handle on the -4dB curve
ci.children(1).foreground=color('red'); //draw it in red

j=3; // the index of the -45° curve
cj=c(10+j); //the handle on the -45° curve
cj.children(1).thickness=3;//draw it thicker
Examples
//Hall chart
clf();hallchart()
//Hall chart as a grid for nyquist
s=poly(0,'s');
Plant=syslin('c',16000/((s+1)*(s+10)*(s+100)));
//two degree of freedom PID
tau=0.2;xsi=1.2;
PID=syslin('c',(1/(2*xsi*tau*s))*(1+2*xsi*tau*s+tau^2*s^2));
clf();
nyquist([Plant;Plant*PID],0.5,100,["Plant";"Plant and PID corrector"]);
hallchart(colors=color('light gray')*[1 1])
//move the caption in the lower rigth corner
ax=gca();Leg=ax.children(1);
Leg.legend_location="in_lower_right";
See Also
| << h_norm | CACSD | hankelsv >> |