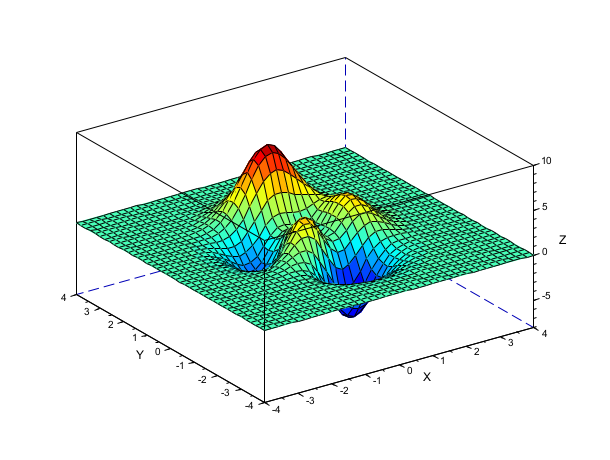
peaks
Computes values of a function with lots of local maxima and minima.
Syntax
[XX, YY, ZZ] = peaks()
[XX, YY, ZZ] = peaks(n)
[XX, YY, ZZ] = peaks(x, y)
ZZ = peaks(...)
Arguments
- n
Grid size. Default value is 49.
- x
Grid over X-axis.
- y
Grid over Y-axis.
- XX, YY, ZZ
Computed coordinates.
Description
peaks returns the Cartesian coordinates of peaks function (without drawing it). The returned coordinates can be then plotted using surf.
If n is a scalar, then coordinates are computed over a n x n grid. If n is a vector, then the coordinates are computed over a grid defined by n values (used for X-axis and Y-axis).
When called with two input arguments, peaks computed coordinates over a grid defined by x values (for X-axis) and by y values (for Y-axis).
When called with only one output argument, peaks returns only z-coordinates.
The peaks function is defined as

See also
- surf — 3D surface plot
History
| Version | Description |
| 2025.1.0 | Function peaks introduced. |
| Report an issue | ||
| << param3d properties | 3d_plot | plot3d >> |