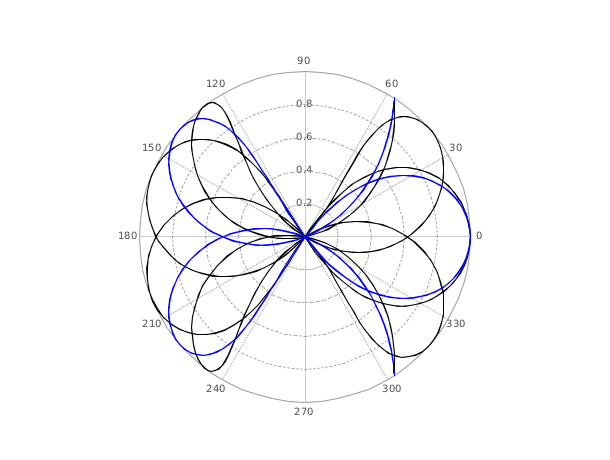
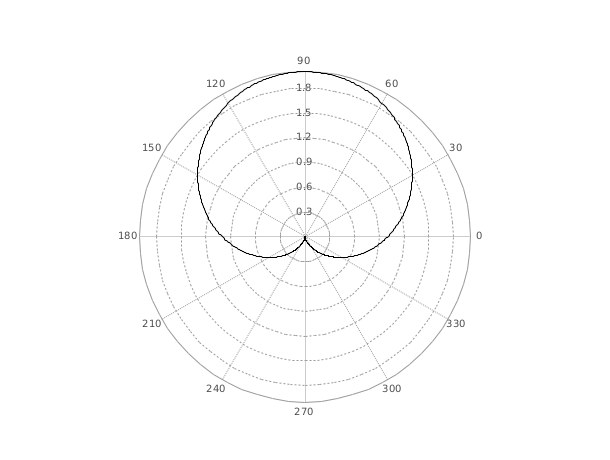
polarplot
極座標プロット
呼び出し手順
polarplot(theta,rho,[style,strf,leg,rect])
polarplot(theta,rho,<opt_args>)
h = polarplot(...)
引数
- rho
ベクトル, 半径の値
- theta
rho と同じ大きさのベクトル , 角度の値.
- <opt_args>
一連の命令
key1=value1, key2=value2, ... ただし, keys はstyle,leg,rect,strfまたはframeflagとすることができます- style
大きさ ncの実数行ベクトル. 曲線
iに適用されるスタイルはstyle(i)で定義されます.デフォルトのスタイルは1:nc(1は最初の曲線e, 2 は2番目, など.)です.- -
style(i)が負の場合, 曲線は IDabs(style(i))+1のマーカにより描画されます. See polyline properties to see the mark ids.- -
style(i)が厳密に正の場合, 色IDstyle(i)を有する実線または破線IDstyle(i)を有する破線が使用されます. See polyline properties to see the line style ids.- -
曲線が1つだけ描画される場合,
styleは 大きさ2の行ベクトル[sty,pos]とすることができます. ただし,styはスタイルを指定するために使用され,posは1から6の範囲の整数で,関数plot2dを複数回コールして複数の曲線をプロットし, 各曲線にキャプションを付加したい場合に有用です.
- strf
長さ3の文字列
"xy0".- default
デフォルト値:
"030".- x
キャプションの表示を制御,
- x=0
キャプションなし.
- x=1
キャプションは表示されます. オプションの引数
legにより指定されます.
- y
フレームの計算を制御します.frameflagと同じ.
- y=0
(他の高レベルプロット関数への前のコールにより設定された) カレントの境界が使用されます.複数のプロットを 重ねる際に便利です.
- y=1
オプションの引数
rectはプロット境界を 指定する際に使用されます.- y=2
プロットの境界は
xおよびyの最小/最大値により計算されます.- y=3
y=1と同じですが,等軸スケールとなります..- y=4
y=2と同じですが,等軸スケールとなります.- y=5
y=1と同じですが,plot2dは プロットの境界および軸の目盛を変更でき, 見栄えの良いグラデーションを生成することができます. ズームボタンをアクティブにする時,このモードが使用されます.- y=6
y=2と同じですが,plot2dは グラデーションの見栄えを良くするために プロットの境界と軸のメモリを変更できます. zoom関数がアクティブになった場合,このモードが使用されます.- y=7
y=5と同じですが, 新規プロットのスケールはカレントのスケールにマージされます.- y=8
y=6と同じですが, 新規プロットのスケールはカレントのスケールにマージされます.
- leg
文字列. 引数
strfの最初の文字が1の場合に 使用されます.legは"leg1@leg2@...."という形式で,leg1,leg2,などは,それぞれ最初の曲線のキャプション, 2番目の曲線のキャプション, などです. デフォルトは""です.- rect
この引数は引数
strfの2番目の文字が1,3または5の 場合に使用されます. この引数は大きさ4の行ベクトルで,フレームの次元を指定します:rect=[xmin,ymin,xmax,ymax].- h
This optional output contains a handle to a Compound entity which is described below.
説明
polarplot は,角度 theta に対して半径 rho をプロットする極座標プロット を作成します. theta はx軸からベクトルradius (単位:ラジアン)までの角度です; rho はデータ空間単位で指定されたベクトルradiusの長さです. rhoの値が負の場合,対応する曲線の点が原点対称に折り返されます.
The optional output hcontains a handle to a Compound entity whose children are:
h.children(1): Compound whose children are the labels of angle values (Text entities)h.children(2): Compound whose children are the lines of radial frame for each angle value (Segs entities)h.children(3): Compound whose children are the labels of radius values (Text entities)h.children(4): Compound whose children are the circles of constant radius for each radius value (Arc entities)h.children(5): Polyline entity, the main curve.
h to modify properties
of a specific or all Text, Segs or Arc entites after they are created. For a list of
properties, see Polyline_properties,
segs_properties or
arc_properties.例4
clf
theta = [0:0.02:2*%pi]';
rho = 1+0.2*cos(theta.^2);
polarplot(theta, rho, style=5)
gca().data_bounds = [-1.2,-1.2 ; 1.2,01.2];

History
| バージョン | 記述 |
| 2025.0.0 | Function returns the created handle(s). |
| Report an issue | ||
| << plotimplicit | 2d_plot | scatter >> |


