plot3d3
矩形の小平面により定義される曲面のメッシュプロット
呼び出し手順
plot3d3(X,Y,Z [,vect,theta,alpha,leg,flag,ebox])
plot3d3(X,Y,Z, <opt_args>)
[hdl1,hdl2] = plot3d3(...)
引数
- X, Y, Z:
データ構造を定義する実数行列.
- vect
実数ベクトル.
- <opt_args>
一連の命令
key1=value1, key2=value2,...を表し,key1,key2,...は以下のどれかとすることができます: theta, alpha ,leg,flag,ebox (以下の定義を参照).- theta, alpha
観測点の球座標を指定する実数値(単位:度).
- leg
各軸のラベルを定義する文字列. @ をフィールドセパレータとし, "X@Y@Z"のようになります.
- flag
大きさ4の実数ベクトル.
flag=[vertical_color, horizontal_color,type,box].- vertical_color
整数 (曲面の色), デフォルトは 3.
縦方向のエッジを描画する際に使用される色を定義するカラーマップのインデックス.
- horizontal_color
整数 (曲面の色), デフォルトは 4.
水平方向のエッジを描画する際に使用される色を定義するカラーマップのインデックス.
- type
整数 (スケール).
- type=0:
プロットは (前の
param3d,plot3d,contourまたはplot3d1のコールで設定された) カレントの3次元スケールで行われます.- type=1:
3次元ボックスのスケールがアスペクト比の最大値に基づき 自動的に調整され, 境界はオプションの引数
eboxの値で 指定されます.- type=2:
3次元ボックスのスケールがアスペクト比の最大値に基づき 自動的に調整され,境界は指令したデータにより計算されます.
- type=3:
オプション
eboxで指定したボックス境界を有する 3次元等軸プロットで,type=1に似ています.- type=4:
データで定義された境界に基づく3次元等軸プロットで,
type=2に似ています.- type=5:
オプション
eboxで指定されたボックス境界で 定義された境界に基づく3次元拡張等軸プロットで,type=1に似ています.- type=6:
データで定義された境界に基づく3次元拡張等軸プロットで,
type=2に似ています. 軸の境界は axes エンティティプロパティによりカスタマイズできる ことに注意してください(axes_properties参照).
- box
整数 (プロットの周囲のフレーム).
- box=0:
プロットの周囲に何も描画されません.
- box=1:
実装されていません (box=0と同様).
- box=2:
曲面の背後の軸のみが描画されます.
- box=3:
曲面を囲うボックスが描画され,キャプションが追加されます.
- box=4:
曲面を囲うボックスが描画され,キャプションと軸が追加されます.
軸のアスペクトもaxesエンティティのプロパティによりカスタマイズ できることに注意してください (axes_properties参照).
- ebox
プロットの境界をベクトル
[xmin,xmax,ymin,ymax,zmin,zmax]で指定します. この引数は,flagのtypeが1,3または5に設定された場合, 使用されます (対応する動作については上記参照).flagが指定されない場合eboxは無視されます.指定された場合,
ebox引数は,data_boundsに基づいて動作し, axesエンティティのプロパティによりリセットすることも可能であることに 注意してください. ebox のデフォルト値は[0,1,0,1,0,1]です.(axes_properties参照)- hdl1, hdl2
These optional outputs are vectors of
Polylineentities containing the two sets of entities for each isoparametric curve. Use them to eventually modify their properties For a list of properties, see polyline_properties.
Description
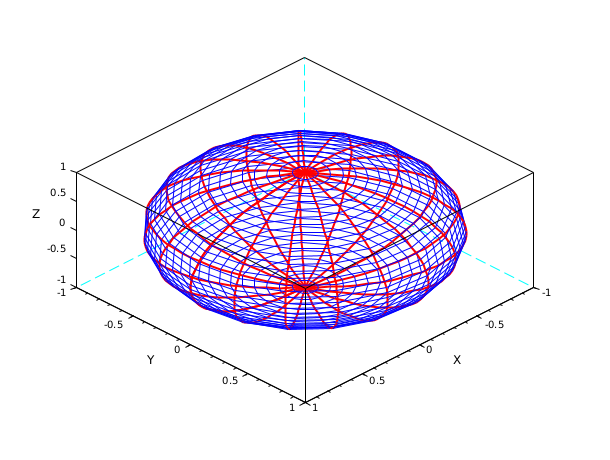
plot3d3 performs a mesh plot of a surface defined by facets
X(i,j), X(i+1,j), X(i+1,j+1) and X(i,j+1) (similarly Y and Z matrices contain Y and Z-coordinates). However, unlike mesh which draws these facets
plot3d3 draws two sets of isoparametric curves defined respectively by (X(i,:),Y(i,:),Z(i,:)) and
by (X(:,j),Y(:,j),Z(:,j)).
The vect vector is used when multiple surfaces are coded
in the same (X,Y,Z) matrices. vect(j) gives the line at which
the coding of the jth surface begins. See plot3d2 for a full
description.
例
u = linspace(-%pi/2,%pi/2,40);
v = linspace(0,2*%pi,20);
X = cos(u)'*cos(v);
Y = cos(u)'*sin(v);
Z = sin(u)'*ones(v);
[h1,h2]=plot3d3(X,Y,Z);
h1.foreground=color("red")
h2.foreground=color("blue");
h1.thickness=2;

参照
History
| バージョン | 記述 |
| 2025.0.0 | Function returns the created handle(s). |
| Report an issue | ||
| << plot3d2 | 3d_plot | scatter3d >> |