Matplot properties
Description of the Matplot entities properties
Description
The Matplot entity is a leaf of the graphics entities hierarchy. It
represents 2D plots of surface using colors and images (see
Matplot and Matplot1).
- parent
Graphic handle of the Matplot's parent, that should be of the type
"Axes".- children
vector of
childrenof the Matplot object. By default, aMatplotentity has nochild, and.childrenis[].- visible
"on"(default) or"off". If"off", the Matplot patch is not displayed.- data
(m,n)matrix or(m,n,nc)hypermatrix of decimal, (u)int8, (u)int16, or (u)int32 numbers representing a matrix of (m,n) colors onnc = 1|3|4channels to be plotted. The color encoding/decoding is set by theimage_typeproperty. The color associated todata(i,j,:)is used do draw and fill a small rectangle of fixed sizes touching its neighbors and centered at the(i,j)location.- rect
vector
[xmin, ymin, xmax, ymax]defining a rectangle in data scales of the parent axes. The fulldatamatrix is scaled accordingly to fill therectshape:- Its
mrows cover the[ymin, ymax]interval. - Its
ncolumns cover the[xmin, xmax]interval.
The
data(i,j)pixel is drawn in the small rectangle bounded byX = xmin + [j-1, j]*(xmax-xmin)/nandY = ymax - [i-1, i]*(ymax-ymin)/mIf one
rectbound goes beyond the corresponding.parent.data_bounds(i)axes bound, the overflowing side of thedatamatrix will be clipped, unless.clip_stateis set to"off".- Its
- image_type
this field defines the image type. It could be one of the values: "index", "gray", "rgb", "rgba", "argb", "red", "green", "blue", "rgb332", "rgb444", "rgb555", "rgb4444", "rgb5551".
Colors are determined by the data type and by
image_type:- "index"
dataare colors indices in the colormap.- "gray"
dataas a matrix of int8 or uint8 provides Gray level color (R-G-B=GRAY-GRAY-GRAY).- Otherwise,
datais considered as RGB levels and converted into gray colors (0.299*R+0.587*G+0.114*B).
- "rgb"
dataas an hypermatrix of int8 or uint8 provides the RGB components ;dataas an hypermatrix of doubles provides normalized RGB components (values between 0 and 1) ;dataas a matrix of int8 or uint8 with a number of rows multiple of 3 provides the RGB components ;dataas a matrix of int32 provides RGB colors ;dataas a matrix of uint32 provides RGBA colors where the alpha channel will be set to 0xFF.
- "rgba"
dataas an hypermatrix of int8 or uint8 provides the RGBA components ;dataas an hypermatrix of doubles provides normalized RGBA components (values between 0 and 1) ;dataas a matrix of int8 or uint8 with a number of rows multiple of 4 provides the RGBA components ;dataas a matrix of int32 or uint32 provides RGBA colors.
- "argb"
dataas an hypermatrix of int8 or uint8 provides the ARGB components ;dataas an hypermatrix of doubles provides normalized ARGB components (values between 0 and 1) ;dataas a matrix of int8 or uint8 with a number of rows multiple of 4 provides the ARGB components ;dataas a matrix of int32 or uint32 provides ARGB colors.
- "red"
dataas a matrix of int8 or uint8 provides Red level color (R-G-B=RED-00-00).dataof another type is considered as RGB intensities. They are then converted into red levels (a mask is applied to keep the Red component).
- "green"
dataas a matrix of int8 or uint8 provides Green level color (R-G-B=00-GREEN-00).dataof another type is considered as RGB intensities. They are then converted into green levels (a mask is applied to keep the Green component).
- "blue"
dataas a matrix of int8 or uint8 provides Blue level color (R-G-B=00-00-BLUE) ;dataof another type is considered as RGB intensities. They are then converted into blue levels (a mask is applied to keep the Blue component).
- "rgb332"
dataas a matrix of int8 or uint8 provides RGB colors where R component is wrote on 3 bits, G component on 3 bits and B component on 2 bits.- For other
datatypes, RGB (8-8-8) data are converted into RGB (3-3-2).
- "rgb444"
dataas a matrix of int16 or uint16 provides RGB colors where each components is wrote on 4 bits.- For other
datatypes, RGB (8-8-8) data are converted into RGB (4-4-4).
- "rgb555"
dataas a matrix of int16 or uint16 provides RGB colors where each components is wrote on 5 bits.- For other
datatypes, RGB (8-8-8) data are converted into RGB (5-5-5).
- "rgb4444"
dataas a matrix of int16 or uint16 provides RGBA colors where each components is wrote on 4 bits.- For other
datatypes, RGBA (8-8-8-8) data are converted into RGBA (4-4-4-4).
- "rgb5551"
dataas a matrix of int16 or uint16 provides RGBA colors where each non-alpha components is wrote on 5 bits and the alpha component on 1 bit.- For other
datatypes, RGBA (8-8-8-8) data are converted into RGBA (5-5-5-1).
- clip_state
Its value drives the clipping of the
Matplotpatch outside its parentAxesbox. Possible values are:"off": The Matplot patch is not clipped. Setting.clip_state = "off"automatically resets.clip_box = []."clipgrf": The Matplot patch is clipped outside its parent axes. Setting.clip_state = "clipgrf"automatically resets.clip_box = []."on": The Matplot patch is clipped outside the rectangle defined by theclip_boxproperty.
- clip_box
empty matrix
[](default) or[x,y,w,h](upper-left point width height) bounds (in data scales) of the rectangular area outside which the Matplot patch must be clipped. Setting.clip_box = [x y w h]automatically sets.clip_state = "on".- user_data
this field can be use to store any scilab variable in the
Matplotdata structure, and to retrieve it.- tag
Single text that can be used as identifier/name of the Matplot object.
findobj("tag", tag_value)will then return its full graphic handle.
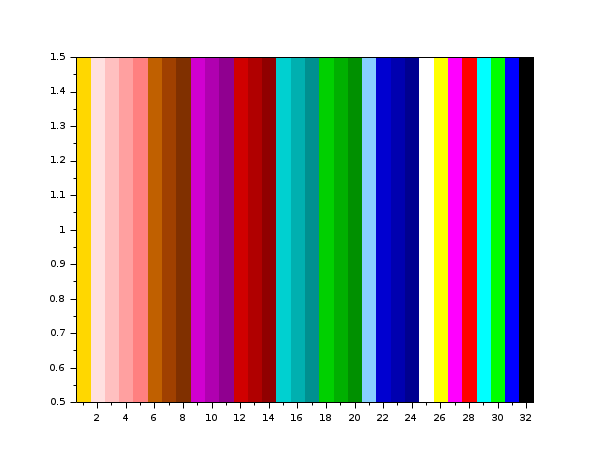
Examples
nbcolors = size(gcf().color_map, 1);
Matplot(1:nbcolors)
e = gce(); // get current entity
e.data = e.data($:-1:1) // reverse order
See also
- Matplot — 2D plot of a matrix using colors
- Matplot1 — 2D plot of a matrix using colors
- grayplot — 2D plot of a surface using colors
- grayplot_properties — description of the grayplot entities properties
- xrects — draw or fill a set of rectangles
- graphics_entities — описание структур данных графических объектов
History
| Версия | Описание |
| 5.5.0 |
|
| Report an issue | ||
| << Matplot1 | 2d_plot | paramfplot2d >> |