comet
2D comet animated plot
Syntax
comet(y)
comet(x, y)
comet(x, y, Lf)
comet(x, fun)
comet(x, fun, Lf)
comet(..., "colors",c)
Parameters
- x
- a real vector or matrix. If omitted, it is assumed to be the vector
1:npwherenpis the total number of curve points (see below). As a matrix, each column defines the abscissae of the trace of a separate comet. - y
- a real vector or matrix. As a matrix, each column defines the ordinates
of the trace of a separate comet.
nc=size(y,"c")is the number of comets simultaneously drawn. - Lf
- a real scalar in the interval
[0,1[. Default value is 0.1: It defines the Leading fraction of the comet's trace. Thek=Lf*npmost recent points are plotted in thicker line. - fun
- a scilab function with syntax
y = fun(x).funcan also be a polynomial or a rational fraction. - c
nccolors of thenccomets traces. They may be specified as a vector ofnccolor indices or color names or "#RRGGBB" hexadecimal color codes. Or by a matrix (ncx3) of[r,g,b]vectors of Red-Green-Blue intensities in the [0,1] interval.
Description
If (x,y) are two vectors, this function draws a 2D comet animated
plot showing the progression of the curve (x(1:m),y(1:m)) for
m varying from 1 to
np=length(x).
The plot is made of three parts:
| a head | mark that shows the current (x(i),y(i)) position. |
| a body | consisting in the k=round(Lf*np) most recent points
of the trajectory, displayed as a thicker part of the trace. |
| a tail | that shows the (x(1:i-k),y(1:i-k)) part of the curve. |
comet(x,fun,...) is equivalent to
comet(x, feval(x,fun),...).
If x and y are matrices with identical sizes,
then animated curves are drawn for each pair (x(:,j),y(:,j)).
In this case np is the number of rows of
x and y.
comet(...,"colors",c) can be used to set the colors of each
trajectory.
Examples
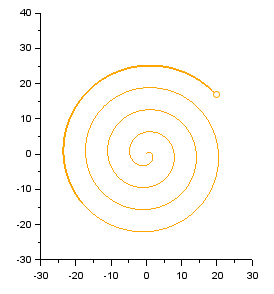
// One comet in spiral:
t = linspace(0, 10*%pi, 500);
clf, isoview
comet(t.*sin(t), t.*cos(t), "colors", "orange")
// Two simultaneous comets with default colors:
t = linspace(0, 10*%pi, 500)';
clf
comet(t.*sin(t), [t.*sin(2*t) t.*sin(3*t)])
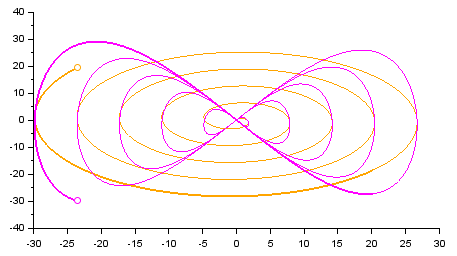
// Chosen colors:
t = linspace(0, 10*%pi, 500)';
clf
comet(t.*sin(t), [t.*cos(t) t.*sin(2*t)], "colors", ["orange" "mag"])
See also
- comet3d — 3D comet animated plot
- paramfplot2d — animation dans le plan d'une courbe définie par une fonction
- realtime — sets the time unit
- colors names — liste des noms de couleurs prédéfinies
History
| Version | Description |
| 5.3.2 | Function comet() introduced. |
| 6.1.0 | Colors can now be specified also by their name, or by their "#RRGGBB" hexadecimal code, or by their [r g b] Red-Green-Blue intensities. |
| Report an issue | ||
| << champ properties | 2d_plot | contour2d >> |