subplot
グラフィックウインドウをサブウインドウの行列に分割する
呼び出し手順
subplot(m,n,p)
subplot(mnp)
引数
- m, n, p
正の整数
- mnp
10進表記の整数
mnp
説明
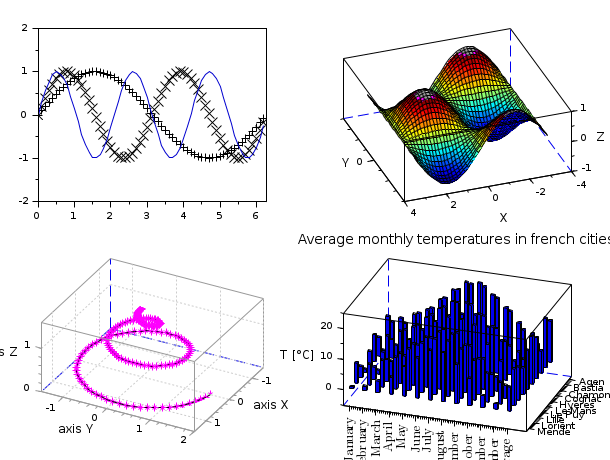
subplot(m,n,p) または subplot(mnp) はグラフィックウインドウを m行n列のサブウインドウの行列に分割し, p番目のサブウインドウを描画先として選択します. サブウインドウの番号は,行優先でカウント,つまり, 行列の要素(i,j)に対応するサブウインドウは(i-1)*n + j番となります.
When the selected area matches exactly an existing axes, subplot(…)
just sets it as the current axes, and returns.
Otherwise, subplot(…) creates an empty axes covering the selected area,
ready to receive forthcoming plotting contents.
例
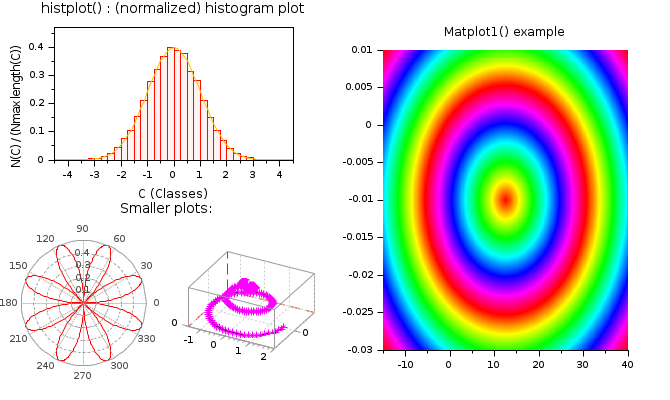
A more complex layout, but still gridable:
clf
subplot(1,2,2)
Matplot1()
xtitle("Matplot1() example","","")

subplot(2,2,1)
histplot
delete(findobj("type","Legend"))

subplot(2,2,3)
title("Smaller plots:", "fontsize",3)

subplot(2,4,5)
polarplot()

subplot(2,4,6)
param3d()
xtitle("","","","")
参照
- xsetech — プロット時にグラフィックウインドのサブウインドウを設定
- newaxes — 新しいAxesエンティティを作成
- axes_properties — axesエンティティプロパティの説明
- plotframe — スケールとグリッドを指定してフレームをプロット. この関数は廃止されました.
| Report an issue | ||
| << sda | axes_operations | unzoom >> |