Math rendering in Scilab graphics
LaTeX またはMathML言語によりScilabグラフィックスで数式を表示する.
使用方法
Scilab 5.2以降, LaTeX または MathML式を記述することが可能です.
LaTeX テキストは先頭を末尾を $ (ドル記号) とし, MathMLは< で開始し, >で終了すること,また文法的に正しいことが必要です.
初回の使用の際,MathMLエンジンの起動はLaTeXよりも時間がかかります. (これらのライブラリは必要な時にオンザフライで読み込まれます)
// LaTeX / MathML目盛の例:
plot2d();
a=gca();

mathml="<mrow><mfrac><mrow><mi>d</mi><mi>y</mi></mrow><mrow><mi>d</mi><mi>x</mi></mrow></mfrac><mo>=</mo><mfrac>" + ..
"<mn>1</mn><msup><mi>y</mi><mn>2</mn></msup></mfrac></mrow>";
// LaTeX/MathML式の混用
a.x_ticks = tlist(["ticks", "locations", "labels"], (0:6)', [mathml;"1";"$\sin(x)$";"3";"$\cos(a) - test$";"5";"6"]);
LaTeXに関する説明
レンダリングエンジンはJavaライブラリJLaTeXMathに基づいています.
JLaTeXMathはLaTeXの数式モードの実装の一つです.
全てのLaTeXのコマンドを処理することができます(欠けている場合には
バグレポートを遠慮なく投稿してください).
逆に, \over のようなTeX コマンドはサポートされていません.
Scilab 5.2.1以降, ギリシャ文字, キリル文字およびラテンアルファベット文字に 関する完全な Unicode が Scilabグラフィックスで処理されます.

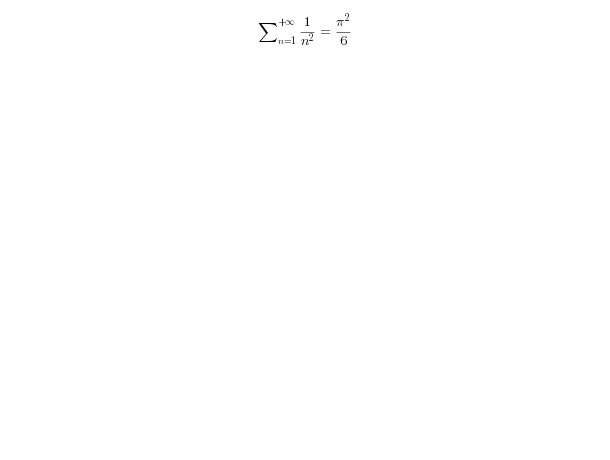
xtitle('$\textstyle\sum_{n=1}^{+\infty}\frac1{n^2}=\frac{\pi^2}{6}$')
xtitle('$\big(\bigg)$')
xtitle('$\mbox{Vector field for }\ddot{\theta}=\sin\theta$')
xtitle('$\JLaTeXMath\ \mathfrak{and}\ \mathtt{Scilab}$')
xstring(0.5,0.5,"$\overbrace{привет\ мир} \underbrace{γειά\ κόσμο}$")
JLaTeXMath では以下のコマンドにより複数のフォントを
指定することができます:
\mathbb, \mathscr,
\mathcal, \mathbf,
\mathit, \mathsf,
\mathtt, \mathfrak,
\mathds, \mathrm,
コマンド\boldsymbolを付けることにより,
ボールド体を指定することが可能です:
xtitle('$\mathbb{SCILAB}\ \mathsf{or}\ \boldsymbol{\mathfrak{Scilab}}$')
xtitle('$\mathscr{C}\mbox{ n''est pas }\boldsymbol{\mathcal{C}}$')
以下のLaTeXパッケージが利用可能です: amsmath, amssymb, stmaryrd, amsxtra およびgraphicsのいくつかのコマンドをサポートする accents. これらのパッケージのコマンドのほとんどが使用可能です (例えば,amsmathのいくつかのコマンドは利用できません).
xtitle('$\sideset{_\alpha^\beta}{_\gamma^\delta}\prod$')
xtitle('$\hat{\accentset{\star}{\hat h}}\undertilde{ABC}$')
xtitle('$\begin{pmatrix}\mathfrak{a}&\alpha\\\mathbb{A}&\mathcal{A}\end{pmatrix}\mbox{ or }..
\begin{bmatrix}\mathfrak{a}&\alpha\\\mathbb{A}&\mathcal{A}\end{bmatrix}$')
xstring(0.5,0.5,'$\left(\frac{\pi}{\sqrt[3]{2}}\middle|\sqrt{\frac{1+\frac1x}{x}}\right\rangle$')
xtitle('$\doublecup\ddag\fatbslash\lll\oplus\ovee\circledcirc\circlearrowright$')
xtitle('$\rotatebox{180}{\boxed{\JLaTeXMath}}\ \reflectbox{\JLaTeXMath}$')
xtitle('$\scalebox{0.6}{\sum_{n=1}^{+\infty}\frac1{n^2}=\frac{\pi^2}6}$')
xtitle('$\fcolorbox{black}{Tan}{\JLaTeXMath}$')
xtitle('$\textcolor{Magenta}{\mathfrak{Scilab}}\mbox{ and }\textcolor{Green}{\mathcal{SCILAB}}$')
以下のように新しいコマンドや環境を定義することも可能です:
MathML に関する説明
MathML レンダリングは Jeuclidに基づいています. Jeuclid は MathML 実装の一つで,仕様全体をカバーしています. これにより、 MathML言語の全てが Scilabによりサポートされます.
Jeuclid ライブラリの大きさのため, 初回の使用時にロードに数秒かかります. しかし,次回以降は高速化されます.

plot3d();
a=get("current_axes");
a.x_label.font_size= 5;
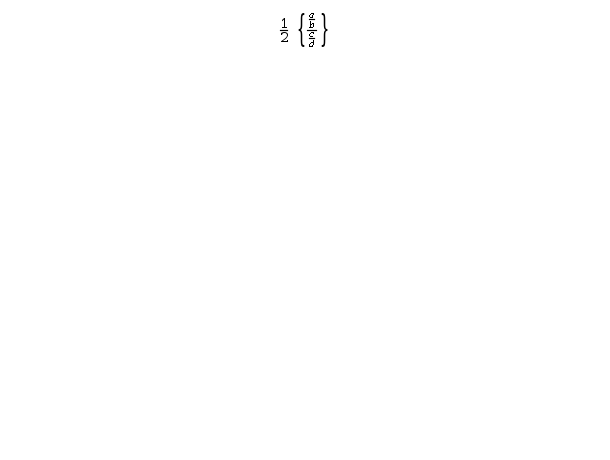
a.x_label.text="<mrow><mfrac><mrow><mn>1</mn></mrow><mrow><mn>2</mn></mrow></mfrac><mo></mo><mfenced open=""{"" close=""}"">" + ..
"<mrow><mfrac><mrow><mfrac><mrow><mi>a</mi></mrow><mrow><mi>b</mi></mrow></mfrac></mrow><mrow><mfrac><mrow>" + ..
"<mi>c</mi></mrow><mrow><mi>d</mi></mrow></mfrac></mrow></mfrac></mrow></mfenced></mrow>"
参照
- xtitle — グラフィックスウインドにタイトルを追加する
- axes_properties — axesエンティティプロパティの説明
- label_properties — Labelエンティティプロパティの説明
- legend_properties — Legend エンティティプロパティの説明.
- text_properties — Textエンティティプロパティの説明
- xstringb — 文字列をボックス内に描画
- xstringl — 文字列を囲うボックスを計算
- xstring — 文字列を描画
- uicontrol — グラフィックユーザーインターフェイスオブジェクトを作成
- uimenu — 図にメニューまたはサブメニューを作成する
| Report an issue | ||
| << graphics_fonts | text | stringbox >> |